

corey scher
@coreymaps
Followers
1,659
Following
901
Media
35
Statuses
200
PhD candidate studying physical impacts of war and conflict @CUNYGCEES . Satellite radar 🛰️ and #InSAR nerd 🌊
new york city
Joined August 2014
Don't wanna be here?
Send us removal request.
Explore trending content on Musk Viewer
WEIBO LIVE X FAYEYOKO
• 145073 Tweets
百鬼夜行
• 90824 Tweets
#西園寺さんは家事をしない
• 55622 Tweets
Martes 13
• 42550 Tweets
#HUEAreMyEverything
• 37343 Tweets
#휴닝카이가수놓은여름밤의은하수
• 36170 Tweets
ゴリラ審神者
• 35470 Tweets
シャトレーゼ
• 29366 Tweets
ガラスの仮面
• 28650 Tweets
#愛され天使ヒュニンカイ
• 21998 Tweets
D-14 TO CHANYEOL SOLO
• 21594 Tweets
OUR BAND LEADER HUENINGKAI
• 21233 Tweets
للهلال
• 16873 Tweets
さんま御殿
• 15531 Tweets
CRAZY TRACK SAMPLER
• 15247 Tweets
計画運休
• 14650 Tweets
浪川さん
• 14622 Tweets
高難易度
• 14380 Tweets
レイド戦
• 14063 Tweets
警告試合
• 13218 Tweets
高津監督
• 11541 Tweets
#インターネット老人会検定
• 10251 Tweets
横井さん
• 10111 Tweets


Pinned Tweet

A nationwide survey of damage to buildings in Ukraine is a big part of my dissertation research.
@JamonVDH
and I worked with the talented
@TmarcoH
and
@wallacetim
to support their team
@nytimes
reporting on damage with our data.
Their piece is out today:
1
6
10
An app to track the Russian convoy build-up north of Kyiv using Sentinel-1 satellite 🛰️ data is now available here:
You can measure distance(s) interactively and it will automatically update as new images come online.
#Ukraine
#GEOINT
#EarthEngine

The convoy also seems to be visible in Sentinel-1 radar imagery, showing how it stretches beyond the extent of the optical image. Feb 16 vs. today.
@sentinel_hub
20
248
1K
35
418
879
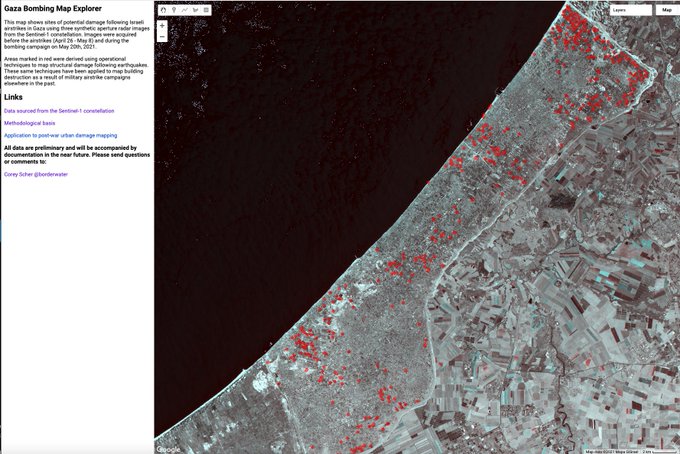
Satellite 🛰️ radar from
#Sentinel1
can be used to map damage from military conflict in urban areas. Here is a
#GoogleEarthEngine
app of sites of potential damage from Israeli airstrikes on
#Gaza
using
#InSAR
analytical techniques➡️
#openEO
#geoint
#InSAR
5
40
126
Though cloud obstruction prevents Maxar optical sensors from collecting more high-res data, satellite radar can "see through" clouds
Yesterday at 5:45PM local time in Kyiv, Sentinel-1A imagery showed the convoy stalled at the same spot as Feb. 28
App:

This 3D video by
@Maxar
shows the Russian military convoy northwest of Kyiv (not the entire 40-mile length, but gives a good impression). Note: this is from the previously Feb. 28 satellite imagery. It's been too cloudy for new satellite imagery updates.
10
84
183
3
31
80
One of the men below recorded the new Thelonious Monk album "Palo Alto" in 1968. Was he in your family? Do you remember his story? My dad organized the concert and one of these gentlemen recorded it. Can we make some magic happen and find his name?
@VerveRecords
@tedgioia

5
42
66
Correction: as of March 3 at 5:45PM local time in Kyiv,
@esa
Sentinel-1 🛰️ radar data suggests the Russian convoy moved on sometime between Feb. 28 and March 3
Thanks to
@kikollan
&
@ckoettl
for their interest, which moved me to take a closer look and find a bug in my code 🙏

Though cloud obstruction prevents Maxar optical sensors from collecting more high-res data, satellite radar can "see through" clouds
Yesterday at 5:45PM local time in Kyiv, Sentinel-1A imagery showed the convoy stalled at the same spot as Feb. 28
App:
3
31
80
1
17
52
Collaboration with
@ForensicArchi
on environmental violence in Gaza and Colombia on display at
@u_jazdowski
in Warsaw; featuring very cool work generally and some remote sensing from yours truly. Up for six months — check it out!


3
10
31
The source code is now available on
@github
:
And a link to the code snapshot directly in Google Earth Engine:
0
7
28
As a PhD student I mainly research how to put colorbars on geospatial plots in python
2
1
22
Satellite radar sensors are very sensitive to the presence of surface water. The blue areas plotted below from recent Sentinel-1 🛰️ radar images show 11km² of new inundated area focused in the Irpin River floodplain north of Kyiv.


We have been tracking the floods north of Kyiv
#Ukraine
with interest. Some thoughts:
Water from the river Irpin and Kokza is not flowing into the Dnieper as it should. Instead, it is backing up & flooding low-lying areas, now over 20 km2 in extent, growing ~25% since Fri (1/x)


1
7
17
1
13
22

Israeli spraying herbicide along the Gaza siege perimeter is damaging Palestinian crops. Investigation by
@ForensicArchi
is out. I helped identify herbicide damage from satellite image time series for this work. Find it covered here:
0
10
15
I visited a second grade class today as "a scientist" and did not confirm or deny the existence of unicorns. The teacher is now fielding questions of this sort 👇

1
0
16

Glaciers changing in the Himlalayas -- slow but stead retreat of the teal. False color landsat 5 and 8 images
0
5
12
My friend asked me to name two vessels that carry water and I was like "well, dam!"
2
1
12
Thanks to everyone who attended the
@NASAARSET
training on proxy damage mapping during military conflict with
#InSAR
this week.
ICYMI, the video and slides of the training are available here:
And Jupyter notebooks are here:

1
5
11

0
10
11
I analyzed the Landsat archive for this
@Greenpeace
and
@ForensicArchi
investigation into the burning of peat land for palm oil plantation development. Check the normalized burn ratio time lapse below

Fires have been used to clear vast areas of forests in remote areas of West Papua. Our latest investigation with
@greenpeace
shows that many of these fires have been set intentionally by industrial palm oil producers.
3
53
79
1
3
11
Scientists and space agencies use satellite radar to map building damage after catastrophes b/c radar is sensitive to changes not always visible from optical images acquired directly overhead.
Check out our
@NASAARSET
training on damage mapping during conflict to learn more 👇


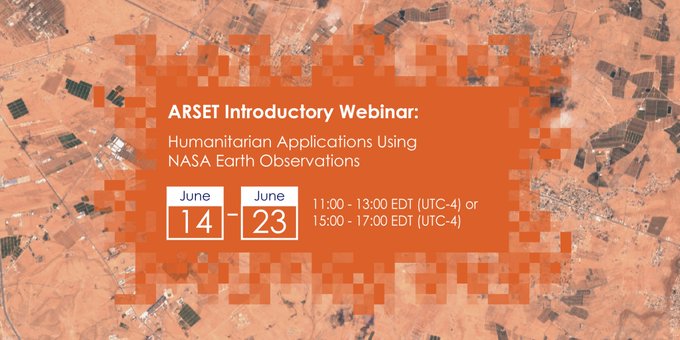
Humanitarian Applications Using NASA
#EarthObservations
starts tomorrow. This four-part introductory training will occur in the days surrounding
#WorldRefugeeDay
. Register and learn how NASA satellite imagery can help to inform
#humanitarian
aid:
0
6
17
2
1
15
Have I shared this gif yet? Radar backscatter from
#Sentinel
and reanalysis air temp data over a glaciated portion of the Himalayas. Glaciers are a reliable target for determining freeze/thaw characteristics from satellite radar!
1
1
10
Are you studying environmental or geophysical impacts of war in Ukraine? Please consider submitting an abstract to our
#AGU23
Fall Meeting session on the topic.
CC:
@JamonVDH
@detoxconflict

3
8
9
"The Guardian’s graphics team have prepared this map which shows the extent of the damage to built-up areas in the Gaza Strip as far as it was known, based on data that was available up to 5 November."
cc:
@JamonVDH

0
5
8
The legendary @[my dad] somehow talked Monk into playing at his high school in 1968 and they recorded it! New and previously unreleased Monk coming out soon through
@VerveRecords

There's a ~fab~ new Monk album coming next month, and the back story is as richly textured as the music. On
@MorningEdition
today, I tell that story — and, with help from Robin D.G. Kelley and Danny Scher, reflect on how it speaks to us right now.
13
96
326
0
1
8
At
#AGU23
tomorrow afternoon, I'll present for the first time on nearly two years of work with
@JamonVDH
: satellite-based mapping of damage in Ukraine across the duration of the 2022 Russian invasion.
Part of an important session on conflict impacts and Earth observation 👇


#AGU23
I am so excited for a wonderful line up of talks in our session, GC23A Advances in Earth Observation & Monitoring Environmental Impact of Armed Conflicts in Ethiopia, Sudan, Colombia, Middle East, and Ukraine.
Join us 👇🏾
📍Tuesday, 2:10 PST | MC, 2006-West

0
4
20
1
2
8
Another app from
@JamonVDH
shows potential damage to agricultural and forested areas following the airstrikes using
#Sentinel2
data, environmental change detection, and
#GoogleEarthEngine

New
#GoogleEarthEngine
🌍 app to detect, visualize, and document vegetation damage in
#Gaza
👉
Choose your Sentinel-2 🛰️ images, customize your settings, map prominent changes, and export locations💾
#openEO
for open conflict monitoring /thx
@jstnbraaten
2
19
71
1
0
7
Reminder that tomorrow
@JamonVDH
and I are doing an introductory training on mapping proxies for urban damage during military conflict with Sentinel-1
#InSAR
⬇️
Humanitarian Applications Using NASA
#EarthObservations
starts tomorrow. This four-part introductory training will occur in the days surrounding
#WorldRefugeeDay
. Register and learn how NASA satellite imagery can help to inform
#humanitarian
aid:
0
6
17
0
2
7
Tasked w/ visual quality control of a couple thousand
#ECOSTRESS
images, I made this little tool in a
#Jupyter
notebook for fast and easy flagging of
#remotesensing
images that look OK for further analysis.
Code here:
#NASAInterns
0
2
7
Just tweeting a little overdue hello to all my fellow
#NASAInterns
this summer as we all work from home! I am “at”
@NASAJPL
working on fusing thermal radiometer and satellite radar to study glacier melt processes. If you nerd on remote sensing and water - I do too! 👋
0
0
7
With so much water coming down in California, how can we *still* be in drought?
The answer: chronic groundwater overuse.
My dear friends
@RichPauloo
+
@HydroGeoPhys
gave comment on behalf of our consulting shop (
@waterdatalab
) in a
@Newsweek
piece today
0
0
5
Our paper mapping glacier melt w/ Sentinel-1 satellite radar 🛰️ data was recently corroborated in a study monitoring glacier lake outburst flood susceptibility.
Exciting and hopeful these techniques can help reduce hazard vulnerability in glaciated areas

0
1
5
"The show didn’t sell out until [my late uncle] Les drove through the parking lot, which was full of East Palo Alto residents, with Monk and his band. “I remember the bass sticking out of the window,” Mr. Scher said."

0
0
6
These results are preliminary and will be accompanied with further analysis and documentation in the coming days. Please contact me with any comments or questions
1
0
4
These pieces going up across SoHo should be preserved and presented long into the future in my opinion


0
1
5
My uncle Les Scher, a true legend in CA and Humboldt County, recently passed away after a 25 year struggle with Parkinson's Disease.
Here he is pictured on the inside cover of Rahsaan Roland Kirk's "Bright Moments" album -- they were close friends.
Obit

0
0
4
Want an introduction to mapping urban damage during military conflict using open source
#EO
data? Then SAVE THE DATE!👇
On June 14,
@JamonVDH
and I will talk damage mapping, including
#InSAR
coherent change detection, and several other talks from our colleagues will follow!
Save the Date!📅 We're organizing the first
@NASAARSET
training on
#humanitarian
applications of NASA
#EO
data with 4 workshops between 14-23 June 2022 scheduled around World
#Refugee
Day 🛰️🛰️🛰️🛰️
@hk_friedrich
@coreymaps
@wxpizza

0
43
96
0
0
4
Dam collapse in Libya reminds me of destabilization of the Mosul Dam:
W/ authors like
@EricFielding
and an undergrad prof of mine, Roland Bürgmann, work like this motivated me to study conflict + geodesy.
Could we see risk of Libyan dam failure coming?

0
2
4
Redefining shallow seismicity in the anthropocene

0
0
4
A little false color composite of satellite radar imagery over CA and NV shows where snow is melting in the Sierra Nevada mountains (areas in red)

1
1
4


0
0
4

@NASAARSET
Big thanks to the
@NASAARSET
team,
@JamonVDH
and my fellow instructors.
I hope that the training helped demystify proxy damage mapping with
#InSAR
and that folks felt empowered to integrate similar methods into their work. 🙏
0
0
3
Tomorrow afternoon at
#AGUChapman
I will discuss measurements of transboundary aquifer compaction as a potential source of information to catalyze governance and accountability in shared international aquifers. I’ll highlight two very contentious case studies!

0
0
3
Here's a full resolution geotiff for the GIS-inclined:
And some background on this type of melt signal if you're extra nerdy:
0
0
3
Update on the first chapter of my dissertation: setting up the matplotlib axes object
0
0
3


1
0
3
“The waters created an effective barrier to tanks and funneled the assault force into ambushes and cramped, urban settings in a string of outlying towns — Hostomel, Bucha and Irpin.”

Satellite radar sensors are very sensitive to the presence of surface water. The blue areas plotted below from recent Sentinel-1 🛰️ radar images show 11km² of new inundated area focused in the Irpin River floodplain north of Kyiv.
1
13
22
0
0
3
@Neiswestnij
@N_Waters89
Thanks for this. All we can say from analyzing the most recent image is that the objects first observed in the Feb. 28 acquisition are also present in the March 3 image. We only know that those objects are a Russian convoy thanks to additional data sources online
1
0
2
Here is a random 100m elevation bin (white) at ~5500m a.s.l. somewhere on the Tibetan Plateau. Hope you're having a good day today!

0
0
2
UPDATE! The names of four janitors who worked at Palo Alto High in 1967-68 were:
Agbayani, Larry
Coyne, Donald
Hartgraves, Ray
Micklus, Edgar
Were any of these people in your family? Have they told you a story about recording Monk? There is still one missing name
#MonkCustodian
0
1
2
“It’s helpful to think of a satellite image as a prism that both clarifies and distorts.” -
@JamonVDH

0
1
2
Just got back from experimental work in the Wax Lake Delta, LA - an area that is actively building land due to a 1940's Army Corp diversion

0
0
1
@j_ai_go
Multi-temporal InSAR coherence data are commonly applied to map damage following earthquakes
It has also been applied to mapping post-conflict urban damage in Mosul City, Iraq

1
0
2
@TimIles_
Yes - it is the normalized difference between two coherence images from two interferograms spanning April 26-May 8 and May 8-20; thresholded for a normalized difference four standard deviations below the mean
0
0
2
It's cool around Mount Shasta (pun) b/c the melt signal (in red) has only made it ~halfway up the mountain

1
0
2
"According to satellite image analysis based on Sentinel-1 radar...up to 18 percent of buildings in the Gaza Strip have been damaged between October 7 to November 5"
cc:
@JamonVDH

0
2
2
@GlacierResearch
@AGU_Cryo
@sonamfutisherpa
@geolidf
Thank you for a great session,
@GlacierResearch
!
0
0
2
"This time, the state can help counties, groundwater agencies and local partners identify susceptible locations and implement rapid solutions...before wells go dry."
@RichPauloo
and
@AlvarEscriva
on preempting well-failure in California before it happens
0
0
2
Thank you, InSAR nerds.

The Open Source NASA-sponsored InSAR Scientific Computing Environment v2 (ISCE2) has a new release 2.4.0 that replaces “master” and “slave” with “reference” and “secondary”. Available at GitHub:
1
41
135
0
0
2
Water experts: sign onto the
#groundwaterstatement
and help make visible the importance of groundwater for sustainable development and equitable resilience to climate change. We have over 500 people from 76 countries signed on thus far

“
#Groundwater
is still misunderstood and poorly managed in many regions. It is therefore important that IAH supports initiatives like the ‘Declaration of Groundwater Sustainability’ ” You too can sign the
#groundwaterstatement
here: ➡️

2
26
49
0
0
2
"How This Israel-Hamas Conflict Is Like Nothing That’s Happened Before" --
@Bloomberg
CC:
@JamonVDH

0
2
2
Note:
#GoogleEarthEngine
does not have capability to work with complex numbers nor does it host single look complex (SLC)
#Sentinel1
data. I simply used GEE to visualize the normalized difference between coherence images from two epochs spanning before the airstrikes and during
0
0
2
@BlockRockDoc
@VerveRecords
@tedgioia
Hi Professor! It was Palo Alto High School and I have not tried FB. Thanks to
@j_a_goncalves
we have some posts on Reddit now that seem to be moving along; one on a Palo Alto sub-reddit and one on the main Jazz page (). I will take to FB shortly!
0
0
2
@m_umar_83
I loaded coherence rasters into GEE after doing the InSAR processing locally. In GEE I simply calculated the normalize difference between two coherence images, associated statistics, and collapsed thresholded normalized difference images to vector points. I will publish code soon
1
0
2
@edsu
Hi Ed — thanks for your interest. We ran a multi-date interferometric synthetic aperture radar coherence analysis following a routine similar to the one we published in Part 1 of our
@NASAARSET
training last year

0
0
1

@matplotlib
Noooo! Foiled again! Well since you seem to have all the answers
@matplotlib
(which you usually do until we need
#cartopy
!!) what is chapter one going to be about now — something about satellite radar and hydrology?!
1
0
1
@Samir_Madani
Yes — these are acquisitions on the same orbit track from Sentinel-1B. Imagery were acquired on April 28, May 8 and May 20 that I used to make two interferograms and associated coherence images for comparison. All images were acquired within the minute of 03:44 UTC on each date
1
0
1
@x4rius
@LinahAlsaafin
@UNOSAT
@wammezz
@TheIntelLab
@bourgoing
@simongerman600
@arabnews
@MariamBarghouti
@ajplus
@AlJazeera
@RedIntelPanda
@adamajacoby
@CharliCaruso
This is extremely important -- thank you for doing this. How can we download the data and work with it? Thank you!!
1
0
1
@RichPauloo
Sorry no legend! I stumbled across this one today from the [recent] vault. The image is centered on Everest in fact and spans ~0.25º longitude -- so its ~25km wide, pixels are 10m
0
0
1
"They used the imagery to study the so-called "normalised burn ratio", comparing it to hotspot data in the same area - intense heat sources picked up Nasa satellites, and put the two datasets together over the same period of time, 2011 to 2016."

0
0
1
@matplotlib
You had me for a second,
@matplotlib
-- I thought my chapter 1 had already been written!
My research however focuses on the affine transform from pixel to geospatial coordinates. (Jokes aside, thank you
@matplotlib
for showing me the ways of figure art!!)
1
0
1
@kikollan
Thank you for your tweet, Dr. Llaneras. Initially I thought the difficulty seeing the convoy was related to the viewing angle on the orbit path (87) from the March 3 acquisition. I just looked at the code, found a mistake and will tweet a correction now
1
0
1