

Matplotlib
@matplotlib
Followers
45,575
Following
117
Media
307
Statuses
14,866
Python library for creating static, animated, & interactive visualizations. Chat w/ us @ Sponsored by @NumFocus
Joined March 2017
Don't wanna be here?
Send us removal request.
Explore trending content on Musk Viewer
Messi
• 404747 Tweets
Adriana Lima
• 231614 Tweets
Allred
• 210853 Tweets
Ted Cruz
• 208606 Tweets
Bolivia
• 104171 Tweets
Peru
• 97806 Tweets
Yankees
• 90455 Tweets
JENNIE KIMMEL LIVE
• 75502 Tweets
カレンダー
• 46119 Tweets
バーニス
• 33277 Tweets
#WorldFoodDay
• 29030 Tweets
शरद पूर्णिमा
• 27879 Tweets
ميسي
• 26286 Tweets
無断生成AI
• 25442 Tweets
Raúl Jiménez
• 23088 Tweets
期日前投票
• 21805 Tweets
The Next Prince Q10
• 20204 Tweets
Lakers
• 19770 Tweets
Nico Paz
• 19664 Tweets
Luiz Henrique
• 17666 Tweets
Andreas
• 17641 Tweets
CHENLE FIRST THROW
• 16249 Tweets
عبدالرحمن المطيري
• 11727 Tweets
メカジンベエザメ
• 10896 Tweets
ボスの日
• 10067 Tweets


Pinned Tweet

Are you a contributor or interested in contributing? doc, code, tutorials, external packages, social media content, cat herding ...
Join our New Contributor Meeting, where we share tips & tricks and try to demystify contributing!
Tuesdays @ 5:00 PM UTC
5
29
118
We have this awesome function called sublots_mosaic where you can pass us a layout id'ed on name
axd = plt.subplot_mosaic(
"""
ABD
CCD
""")


25
383
2K
Congrats! As many people have noted, the image was processed with the help of matplotlib and many other Python libraries helpfully cited in the paper ()

Here's the moment when the first black hole image was processed, from the eyes of researcher Katie Bouman.
#EHTBlackHole
#BlackHoleDay
#BlackHole
(v/
@dfbarajas
)

483
14K
49K
9
291
1K
🤯 it gorgeous

2
65
1K
Happy to announce that Matplotlib 3.0 is up on pypi and ready for use!
Matplotlib is Python 3 only
The v2.2.x LTS branch supports py27 and will get critical bug fixes to 2020
For whats new see
3
292
691
We are incredibly excited to announce that we've been awarded a
@NASA
ROSES grant for open source tools, frameworks, and libraries to build on the CZI work, with a focus on improving unit support. This grant allows us to hire a second RSE, job posting should be up soonish! 🥳
12
61
642

kinda annoyed at boilerplate like ax.set_title(), ax.set_xticklabels, ax.set_ylabel, etc.?
You can do it all in one function! ax.set(title=, xticklabels=, ylabel=, **kwargs)
Check out examples at
9
79
575
OMG we're album art!

HEY GUYS!!! HEY!! HEY GUYS!!! HEY GUYS HEY GUESS WHAT’S OUT ON SPOTIFY AND ITUNES

13
29
160
4
57
496
It's out, it's out! We've been hyping our 3.3 release and it's now officially out!
Semantic axes + easier axes layout, post creation sharing, turbo colormap, simplified advanced tick formatting, infinite straight lines & a whole lot more! Check it out

9
116
492
The amazing
@NPRougier
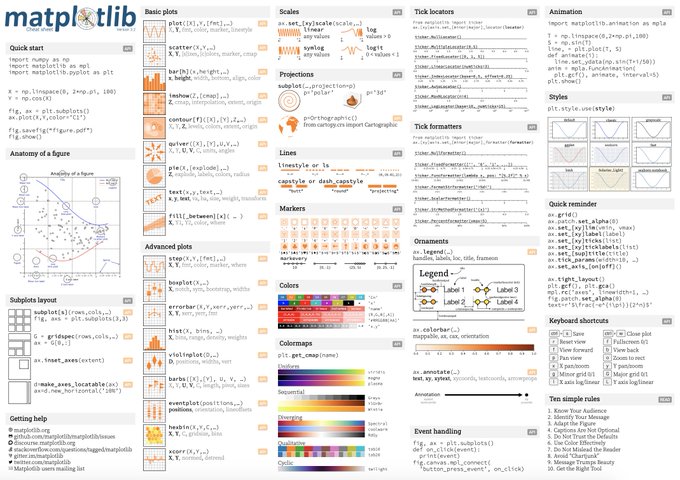
(who has made many of the more explanatory images in our docs) has made this fantastic 3.1 cheatsheet! Find out how at

3
169
472
We are happy to announce Matplotlib 2.1.0!
This is the culmination of 2 years of work by 275 contributors!
1
206
449
Today's new feature in 3.4 is we have a print repr in Jupyter that means you can print the cmap object as a visual

7
33
383
✋


3
21
374
We are launching Matplotblog, a community-run blog to showcase and share great visualization stories.
Check it out and learn how to contribute to it!

3
116
362
Better dates, smarter legends for scatter plots, arbitrary scales - these are just a few of the features & improvements in our 3.1 release! 🎇Check it out at
5
90
347
These are really nice!

Everyone: "It's impossible to create beautiful charts with
@matplotlib
."
Matplotlib: "Hold my beer".
-------------------------------------------------------
Code & examples of +20 charts:


10
94
615
1
34
342
@GaelVaroquaux
@fchollet
Thank you Gael for articulating the balancing act btw. different stakeholders needs, and thank you Francois for popularizing the library despite your frustrations with it. We'd love to hear your pain points; we're rethining both architecture and docs with UX in mind.
5
7
339
This tutorial by
@WayVSubs2019
on code switching in a WayV instagram livestream is legit too good for our little blog & it's also a very comprehensive tutorial on when and how to use step charts y'all should apply to your fave bands. 🎶🎵 🥳

2
104
314
0
55
308
New release! 3.4 has all sorts of goodness, including:
* Subfigures, supx/supylabel
* Centered norm/FuncNorm
* stairs plot and StepPatch
* autolabeling & hatch list for bar chart,
* RangeSlider widget
* 3D panning, stem, error bar
Check out the whole set:

6
63
298
sphinx & intersphinx mean you can click on almost any function call (here `ax.plot` & `np.linspace`) in any of our (& most of our friends) examples/tutorials to get the documentation for that function! 🥰
Here's a short video showing just that!
1
34
279
Made w/ Matplotlib!

Here's the key figure in the paper. It's a comparison of many different ways of measuring the Hubble constant (H0, the present-day expansion rate of the Universe) and the (present-day) matter density (Omega_m). The white circle is the region where most can sort of agree.

18
88
453
0
14
258
Happy to announce Matplotlib 2.2.0!
This is the first release of the 2.2LTS series which will get bug-fixes until 2020.
A big thank you to everyone who worked on this!
3
118
229
🤯

This is
@tldraw
in a notebook, connected to the new GPT-4o vision API. This video is at original speed, and it shows how
@matplotlib
plots are generated from scribbles.
10
95
519
6
36
232
There's a print & open access version!

1
42
225
Please please cite us! Not only cause it helps w/ justification of why we matter, but also 'cause then we can retweet your work 😉

@cziscience
@NumFOCUS
@ThePyPA
@pypi
@brainwane
@pradyunsg
@georgiamoon
@nhmrc
@arc_gov_au
@sidneymbell
@devonzuegel
Seeing all the work of the
#EOSSmtg
grantees was excellent. As
@fperez_org
points out,
@cziscience
support is brilliant, but not enough. 0.1% of federal research spending, $200m/y, would be a start. Note eg
@matplotlib
is used in >10% of arXiv papers but had no funding until now.
1
5
31
1
77
226
our built-in colormaps! if you ever forget, calling pyplot.colormaps() will give you a list of them all :)

3
31
213
Very cool 🎨 tool! 🥰

Looking for the best color palette? 😔
Check the tool we just created with
@joseph_barbier
:
🎨 2500+ palettes
🐍 Python Library to get them
🔍 Easy-to-use application to find your perfect match
Feedback welcome, we're working hard on this right now!
8
185
919
2
20
203
Hey folks, can you do us a favor? If you're doing (or know about) NASA funded work using us, can you let us know? Thanks!
30
50
191
Uh is understandable, but our semantic layout composition function 'subplot_mosaic' might stick better 🥴

By age 30 you should have learned, forgotten, and relearned how to make subplots using matplotlib
33
220
3K
4
15
189
Our devs basically fall into 3 camps: ask Google, ask docs, ask the source code. Code review is a continuous "we do what?", so if you're ever feeling overwhelmed by us, we feel you 😅

@tlyzawx
I have been using Python for 15 years and have been a matplotlib core developer for over 10. I google things about the library all the time.
6
65
495
4
32
182
We're trying to get a version of this into one of our upcoming releases and we need your help! What should we name it?
Check out
@tacaswell
's PR for the technical details:

28
29
160
This is amazing 🤯


0
15
154
Are you interested in community outreach or developer relations? We need you!!! If you've got a few cycles to spare & want to contribute to open source & are passionate about community building and don't quite know where to start, we'll provide mentoring & support. DMs are open.
8
67
150
Scipy tutorial wasn't quite in the cards this year, but we still wanted to give y'all some new way to learn us 😉

Thanks to
@NumFOCUS
,
@matplotlib
now has brand new cheatsheets (1 & 2) and handouts (beginners, intermediate and tips). See .
#Python
#SciPyConf2020


13
654
2K
1
42
146
Newish feature worth knowing about: legend label colors based on the thing being plotted:
labelcolor='linecolor'

2
14
139
A common misconception is that we don't support interactivity; we support loads of exetremly customizable interactivity in multiple backends...we just need some help on making that clearer 🥴
Learn more at:
12
28
134
Uh...

Inspired by
@__mharrison__
and the Styling chapter in Effective Pandas. Embed
@matplotlib
plots inside your
@pandas_dev
dataframe.
#dataviz
😍

7
137
963
1
14
123
statannot is the library that pairs w/ seaborn to annotate statistical plots 😁


@nik_hayes
For ggplot, ggsignif () is my current favorite.
@system001273866
in our lab uses statannot (). Or just rolling your own can sometimes be the best option.
1
0
14
2
14
128
The next feature release of Matplotlib (3.0, targeted for summer 2018) will only support python 3.5+!
1
79
122
🌌

A Toy Model of the Milky Way
Orbital simulation of ~10.000 Milky Way stars using data from
@ESAGaia
.
Red, blue and dim purple stars correspond roughly to the bulge, disk and halo. Integration of the orbits with gala python package (
@adrianprw
). Animated with
@matplotlib
.
3
15
79
0
11
114
Greetings👋!
Have you heard about the latest matplotlib a.k.a. 3.8?
No?
Well it's about time as the new version's been out since September❗
Sorry 'bout that😅
Here's the release note:
In the meantime, let's have a look at some highlights!
1/🧵

1
11
111
🫠

Them: nice graph, how long did it take you?
Me: thanks, 4 years.
9
161
2K
0
11
108
We might need a way to work this into something official...😍😅

Ever wondered what all those
@matplotlib
rc parameters do? Here's a interactive plot style customizer, made with
@streamlit
:
7
186
732
2
15
117
Sneak peak of docs that will be out with the next release (but can now be found at ) showing how to use our date locators & formatters


0
11
117
We've hit 1000 contributors by
@github
count! We estimated we'd already reached that w/ pre-github contributions, but more the merrier!
We could not exist w/o the (often unpaid) contributions of over 1000 people and all the folks contributing to the libraries we rely on 🥰
1
14
114
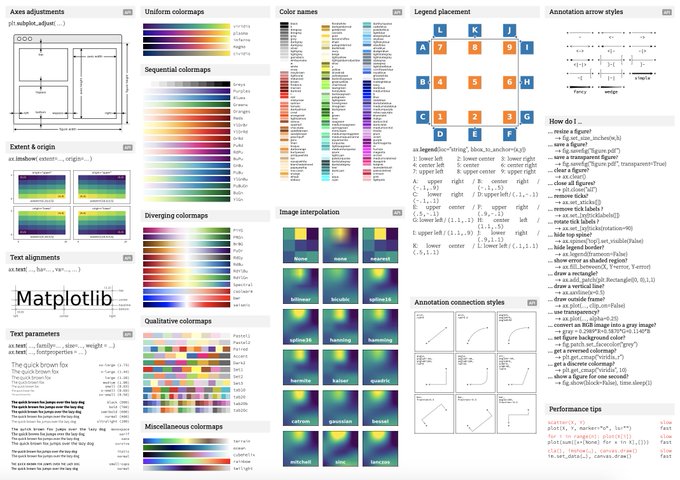
We made this thanks to an awesome
@NumFOCUS
small development grant that let us hire
@NPRougier
to create it.

Data visualization in Python? Here is a great cheat sheet that hopefully can be useful. Please share🙌
#AcademicTwitter
#phdchat
#Bioinformatics
(An accessible PDF version can be downloaded here: )
27
1K
4K
0
19
114
Amazing find c/o
@tacaswell
's friend, a whole library of skateboard trick simulations by Ben Shellswell
0
22
108
Our new landing page is up 🥳! We now have a link to a
@mybinderteam
binder example! Check it out & let us know what you think!

5
14
112

Have multiple plots that should share a colorbar? You can pass in a list/array of axes to fig.colorbar!
fig, axes = plt.subplots(nrows=2, ncols=2);
# loop over axes to plot pcolormesh
fig.colorbar(pcm, ax=axs[:, col], shrink=0.6)

2
19
109
Super cool & also we STRONGLY encourage that you use our object oriented API:
fig, ax = plt.subplots(nrows, ncols)
fig, ax = plt.subplot_mosaic(mosaic)

Matplotlib subplots clearly explained! 📈
Today, we understand:
- Regular subplots
- Subplot-mosaic 🔥
Let's go! 🚀

13
113
505
2
16
105
Our discourse is growing! We've now officially got a section for seaborn questions 😀

2
15
99
🥰
❤️😊😍
There are now 38 high-quality graph tutorials in the Python Graph gallery!
And the list keeps growing 📈
Who said
@matplotlib
's viz are ugly? 😀
Massive thanks to
@joseph_barbier
for the help! 🙏
9
81
406
1
10
100
If you're unsure of which method to use for creating subplots, subplot_mosaic is always a good starting point:
fig, axd = plt.subplot_mosaic([['point', 'area'], ['line', 'line']])


2
10
101
So some of y'all may be wondering, what's our rhyme & reason behind retweets? We're not a bot, so we like human appealing things: code & new & pretty plots & folks genuinely excited about the visualizations they've created & the occasional bit of good visualization advice 😉
4
4
97
This is one of things donations to
@NumFOCUS
gets ya 😉
Feedback pretty please at the repo and !
Thanks to
@NumFOCUS
,
@matplotlib
now has brand new cheatsheets (1 & 2) and handouts (beginners, intermediate and tips). See .
#Python
#SciPyConf2020
13
654
2K
1
17
97
Um this is amazing 🚇

#30DayMapChallenge
Todays topic: 3D
I've probably created 100s of figures with
@matplotlib
in the past years, but I have never used the 3D or animation functionality. Had little time to try. Here is the deepest Metro system in the world. The Moscow Metro with a max depth of 84 m
2
7
62
2
8
98
code included 😁!

1
14
98
While we think it's awesome that y'all are engaging w/ real time data, for the foreseeable future this account will refrain from retweeting
#COVID19
visualizations made by non-experts.

The stakes are high around how we communicate about the
#COVID19
epidemic to the wider public. With
@tableau
,
@JohnsHopkins
, and others making curated datasets available, I'm hoping this article causes
#dataviz
designers to pause before hitting publish.
7
187
396
3
11
95
Spinny things + animated timeseries! 💫🌝

I made an interactive n-body simulator! While the first 100 lines were bug free, the next ~400 were a little trickier 😉
4
12
234
1
10
94
Want smoother backend independent sliders & brush-linking and all sorts of interactive goodies out of the box?
1
22
93
🥰

The more I use Matplotlib, and see what other community members do with it, the more I'm amazed. Open-source-software is the best, so it feels good to share my little creations with the world. Thanks
@matplotlib
!

0
3
21
1
10
94
Us too! 😭


2
5
94
Thank you for funding us! We're very excited for the work this grant supports! 🥰

#Opensource
software is essential to science—that’s why we’re supporting 42 open source tools that accelerate biomedical research and serve the larger community. Learn about the grantees
7
189
436
1
16
93
😲


1
13
92
ipympl is very much our recommended jupyter backend. It's very intuitive and responsive & y'all should totally give it a shot! 🥰

Just released ipympl 0.5.7!
Check out the interactive
@matplotlib
back-end for
@ProjectJupyter
, based on
#ipywidgets
This release includes some code improvements and CSS bug fixes.
Check it out!
1
29
136
2
20
92
Apply, apply, apply! Did you make something pretty/interesting/useful/cool using Python? Then submit! And tell your friend/family/labmate/coworker to! We love seeing and sharing all the awesome visualizations people make using Python.
Submit to the 2019 John Hunter Excellence in Plotting contest!
Submissions due June 8!
3
56
82
3
54
91
Plotnine() is one of the very many, very awesome, 3rd party packages built on top of mpl. 😁
1
16
87
While we support the pyplot interface for the benefit of users coming from other plotting libraries, the OO interface is more flexible and expressive.
1
11
89
Yes. It's a cool plot 👌.
Yes. It's done with matplotlib 👍.
Yes. The code is attached 👇.

Each country is happy for very different reasons!
Here we see the proportion (in %) of 'explained happiness' for different parameters in most European countries.
Always made in
@matplotlib
<3
Reproduce this graph:

6
6
45
2
10
84
Submit to the 2019 John Hunter Excellence in Plotting contest!
Submissions due June 8!

3
56
82
Keep making the same plots over and over? Need them all to have the same look?
@colindcarroll
's Yourplotlib talk on best practices from
@PyData
is up!

1
15
82
We predate a lot of libraries y'all know and love, if you're ever wondering about some of our design choices.😅
(image credit
@teoliphant
)

0
7
82
One of the coolest things about running this account is seeing just how much some of y'all have leveled up. What are some figures that show your journey in visualization?
7
6
78
Happy to announce Matplotlib v2.2.0c1 !
try it out with:
pip install --pre matplotlib
or:
conda install -c conda-forge/label/rc matplotlib -c conda-forge
Please report any bugs to

1
36
77
Hey y'all, we're collecting info on how we're used in companies, research institutions, gov't labs, universities - please tells us all about it! 😁
28
21
76
The magic # is actually 0.045 😜

Python + numpy + matplotlib data visualization
#ProTip
- tired of the ugly missized plot color bars like on the left?
Try 'plt.colorbar(fraction=0.046, pad=0.04)' to get one like the one on the right. Works independently of the figsize. ¯\_(ツ)_/¯

3
11
161
2
12
76
We have a
@github
milestone! Infinite files changed in a PR (as part of the fix our website project undertaken by
@JodyKlymak
) 🥳

4
4
76
Simone does not disappoint 😊.


1
5
78
Trying to get
@verified
via the new interface, do y'all happen to know of any articles mentioning us in reliable/reputable sources? 😅
13
4
73
We currently have 0 applications officially submitted to
@gsoc
, which is due Tuesday 😟 If you were planning to apply, do so now! Upload the draft for some last minute feedback. We can't accept applications unless you submit through google. More info at

3
78
70


Curved histograms!

@matplotlib
As promised. Took a little longer to make it more generalizable, but here is the code as a simple Jupiter notebook.

2
7
38
1
3
71
Wall of stunning 🤯


Btw,
@matplotlib
have you seen my plots in my IG account random_plot, they are all made using matplolib only
1
0
8
1
3
69
@BrentonMallen
@gallamine
@GaelVaroquaux
@fchollet
We love that tutorial to, so much so we got permission to incorporate it into our docs
1
2
69
do you want to make all your x tick labels red? make minor ticks blue? All of 'em size 16 font? There's a function for that! ax.tick_params(axis='x', which='minor', labelcolor='red', color='blue', lablesize=16)
You can also set different grids this way 😉
0
9
68
Animated science 👌.
The importance of using symplectic (energy conserving) integrators in numerical orbital mechanics.
15
98
596
1
8
65
W.E.B Du Bois expertly told the story of post-emancipation Black life through his visualizations and we support the protestors right to safely tell theirs.

America’s criminal justice system isn’t broken. It’s working as designed—to perpetuate systemic racism.
We must continue to work for
#CJReform
and to break down systemic barriers to justice for communities of color.
We stand with our Black community. Black Lives Matter
58
39
129
1
18
68

We're hiring! Come work w/ us as an RSE working on units and internal data representation!

2
31
67
⚽!


2
4
68