
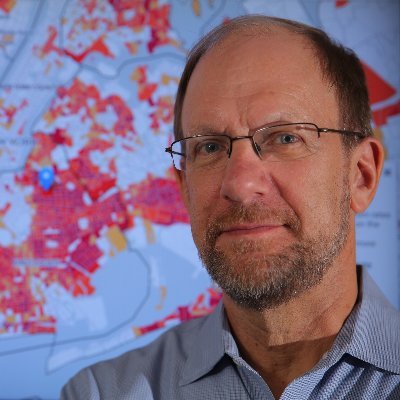
Steven Romalewski
@SR_spatial
Followers
5,045
Following
659
Media
914
Statuses
26,114
“... a researcher at the Center for Urban Research at the City University of New York Graduate Center, who mapped the results.” Photo: Ozier Muhammad/CUNY
New York City
Joined August 2009
Don't wanna be here?
Send us removal request.
Explore trending content on Musk Viewer
CherryOnTop MV OutNow
• 208228 Tweets
Shelley Duvall
• 173039 Tweets
I AM STILL IS COMING
• 168491 Tweets
Tete
• 100015 Tweets
Fenerbahçe
• 81158 Tweets
سلمان
• 77098 Tweets
XCRY EN MTVMIAW
• 67074 Tweets
Abin
• 48288 Tweets
The Shining
• 47654 Tweets
Rest in Peace
• 41451 Tweets
JOSHCULLEN GRAMMY DEBUT
• 39513 Tweets
BODA FURICHA EN SE PICO
• 38897 Tweets
3 Women
• 31607 Tweets
Paolini
• 30777 Tweets
Ali Koç
• 28885 Tweets
celine
• 21592 Tweets
為替介入
• 20590 Tweets
Ramagem
• 15732 Tweets
leticia
• 13534 Tweets
Popeye
• 13251 Tweets
Kubrick
• 10156 Tweets


NYC: 2020 population of 8.8 million. Biggest large city increase from 2010.
25
98
599
The map is incomplete (omits absentee ballots) and just represents the unofficial first round
#NYCMayor
primary results. But it's fascinating nonetheless. We'll be following closely (& mapping) how the ballots move during RCV rounds. cc
@commoncauseny

22
181
464
Striking geographic difference in vote strength b/w Katz and Cabán
#QueensDA
#nycprimary
(Draft map based on unofficial
@BOENYC
night-of results, w/98% reporting.)

27
206
374
Updated map of 2022 unofficial general election results in NYC for governor, as of 9AM 11/9. Citywide (uncertified) vote total almost 1.7 million: Gov. Hochul 70%; Rep. Zeldin 30%.

23
73
292
Here's a side-by-side view of 2014 and 2018 gubernatorial (certified) vote results in NYC along with unofficial 2022 results as of this AM.


15
87
262
Quite a lot going on in this map of unofficial primary results in
#NY10
, but it shows where each of the top candidates appear to have won (or not) so far by election district (including Jimmy Li!).

9
58
214
@bobhardt
The phrase "No words" usually seems so inadequate. But I think here, sadly, it fits perfectly well.
0
6
201
NY Senate district 59 unofficial election night primary results mapped below. Strong showing by
@Gonzalez4NY
especially in north Brooklyn and most of Queens portion of new district.

5
30
179
Initial map (results circa 11pm) of Dem gov primary results in NYC. Map from 2018 primary (Cuomo v Nixon) included for comparison.


6
39
150
A thoughtful, engaging, and important (and short!) video.

0
29
114
This map shows vote distribution by candidate by Assembly district, as well as overall voter turnout by AD.
#QueensDA
#NYCPrimary
(Also draft map based on unofficial
@BOENYC
night-of results.)

4
34
92
Updated map (as of 10:30pm) of unofficial NYC results for governor.

4
28
85
The proposed congressional district plan from the NYS Senate/Assembly via LATFOR is on our Redistricting & You website, where you can easily compare w/current lines & other plans; quickly find your district; and view detailed population/voting data:
1
36
75
Mapped results so far for NYC Council district 9 (per unofficial election night returns).

2
20
77
Should emphasize that NYC didn't have largest percentage increase of the big cities, but *by far* it had the largest magnitude increase (growth of more than 600,000 people). Wow.
5
3
71
Check out our new "Redistricting & You" map , showing population patterns for congressional & state districts, while we all await the
#2020Census
results. Will your district need to expand or shrink? Use the map to find out! 1/n
12
41
73

First map (?) of NY Gov results by ED in NYC, per unofficial
@BOENYC
results as of 9:20pm or so.

7
25
66
FWIW, a map of
#NY12
primary results, based only on votes cast at polling sites, omitting absentee ballots (of which there are many).

14
21
64
@soledadobrien
Conway (K not G) is about as reprehensible as one can get. Maybe not as dangerous as Mitch McConnell, but pretty bad.
2
2
59
Map of 2020 Biden vote share in NYC on Working Families line. Similar patterns to: Teachout support in 2014 gov primary & 2018 AG primary; Sanders support in 2016 primary; and perhaps others but I couldn't fit more maps in this tweet!


2
14
63
@dataKateR
@seecmb
Minnesota also had the greatest share of households voluntarily participating in the 2020 Census (75.1% self-response rate):
0
5
59
A long night, but we've added the updated congressional and state senate maps to
@GC_CUNY
's Redistricting & You, w/an easy comparison to the first draft maps, other plans, and current lines. Here's NY10 as an example:
3
24
60
Re-upping this NYC map of 2018 primary results for Lt. Governor (Kathy Hochul v Jumaane Williams), in case anyone's paying close attention all of a sudden to the current Lt Gov. Screenshot below; link to PDF here: (thx to
@MJLange12
for the reminder!).

6
20
60
New redistricting maps from
@GC_CUNY
. View proposed congressional, state senate, & assembly maps for New York State and compare with current lines: Detailed stats for each district. More here:
#NYSredistricting
#Redistricting

2
23
60
Keep in mind that many of these neighborhoods that seemed to have "turned red" from 2014 to now have often voted for GOP candidates. For ex, 2013 & 2021 mayoral elections & 2020 presidential


3
11
58
@errollouis
@ZackFinkNews
@melissadderosa
@NYGovCuomo
Somewhere, someone is thinking, “If I’ve lost Errol Louis…”
1
2
54
In the interest of full transparency, the
@DistrictingNYC
should still publish the map that was voted down at today's meeting, so the public can review the plan even tho it was rejected. The plan reflects extensive public comment, and the public should be able to review that.
2
24
59
Still very incomplete, but A9310A starting to shape up (manually converting the bill language to a block assignment list).

11
17
58
Vote share by Assembly District for the winner in each AD for the
#NYCPublicAdvocate
special election (still just an initial draft! Will update as I add in the latest BOE results).

3
29
56
The proof-of-vaccine requirements are very reassuring, zero inconvenience, & (hopefully) an incentive to get vaxxed. It's *especially* important to keep the requirements now that other provisions are being relaxed (such as indoor masks). Hopefully
@NYCMayor
rethinks this one.

Does anyone even want this? Vaccine requirements for indoor leisure activities is fantastic. Why would you remove it?
12
9
87
15
13
51
@JonCampbellNY
I’m in a parking lot waiting for the
@Harry_Styles
ONO show to end so I can pick up my daughter. I have my laptop and personal wifi hotspot with me, ready for action!
4
0
56
Striking contrast in vote patterns in tonight's special election results for NY Assembly district 27 (per unofficial
@BOENYC
results); map below.

6
18
50
Mapped vote results for
#NYC
#ElectionNight
ballot proposals 1, 2, and 3, by Assem Dist based on
@BOENYC
unofficial results (90% of scanners reporting).


2
19
50
#NY11
win by
@MaxRose4NY
mapped by election district. Thin margin on SI; fewer total votes in BK but much larger margin there for Rose. Compare w/Donovan's win 2015
#ElectionDay

5
30
49
This
@AnandWrites
interview w/
@StephanieKelton
inspired me to read The Deficit Myth, a great, eye-opening book. And then I watched this
@iamjohnoliver
piece on the nat'l debt & was in tears of joy & laughter. Must read, must watch!


Here's our piece from last night on the national debt...
209
517
3K
3
8
46

We've been able to add the district boundaries from A9310A/S8653A to the
@GC_CUNY
Redistricting & You site . Here's a link showing how NY16 would change in the Bronx:
2
24
46
We've added today's preliminary
@DistrictingNYC
Council district plan to the
@GC_CUNY
Redistricting & You site . Here's an interactive view of one of the proposed districts, for example (dist. 26 that spans Queens & Manhattan):

1
17
47


@ezy06001
@soledadobrien
Different survey. Not the decennial census, which is happening next year. She should know better, and be responsible about her statements, given her position and ability to influence opinion.
4
3
45
@peterbakernyt
@Peggynoonannyc
If anyone called over to me and said “Friends, please come say hello and tell me what you think,” I would not only avoid them completely but I’d laugh at how ludicrous they were. Embarrassing for her to say this (if she actually did), and moreso for you to share it. Sad.
3
2
46
A closer (ED level) look at
#QueensDA
#NYCPrimary
. Dark red EDs show strong support for Caban, w/many fewer 70+% EDs (dark green) for Katz. Also shows mixed support across the boro inbetween western & southeastern Queens. 1/n

1
20
44
Our
@GC_CUNY
team digitized the rejected
@DistrictingNYC
plan and added it to Redistricting & You so the public can see exactly how the plan is different from 7/15 plan, current lines, & other proposals. Here's an example (district 26, wholly in Queens):
3
11
42
NY Senate district 18 (Salazar/Dilan) election district map based on
@BOENYC
unofficial results. Solid support for the challenger in Greenpoint, Williamsburg, and Bushwick.
#NYPrimary

10
12
41
@NYCMayor
@NYCferry
@HeyNowJO
@CMDebiRose
@StatenIslUSA
@Charlesdfall
Um, the *actual* Staten Island Ferry is free, and pretty convenient (and has been working just fine for decades). Why do we need another, which presumably will have a non-zero fare?
1
1
37
Wow, 6 inch aerial imagery for NYC now available for free download Thank you NYS GIS Office &
@NYCDoITT
1
16
40
The
@NYCMayor
‘s assault on
@Columbia
‘s students makes me embarrassed to be a New Yorker tonight. It’s not the first time the “authorities” are out of control, but this seems especially outrageous and unnecessary.

As I watch this, I am horrified. How can the people who ordered this be educators?
251
502
3K
4
14
41
“America, we do have a free speech problem — one that the nation’s most influential newsroom just arguably made worse.” Clear-eyed, well-written analysis as always, from
@Will_Bunch
. via
@phillyinquirer
0
15
40

@erik_engquist
@Azi
@repjoecrowley
Interestingly, Ocasio-Cortez did very well outside areas that are predominantly Hispanic (eg, Astoria and Sunnyside); see attached map.

4
16
37
"ZIP codes are woefully unqualified as units of analysis."
0
25
39
Vote results so far in NYC Council district 47 per
@BOENYC
unofficial results, showing vote strength for each candidate (blue/red shading) + overall vote totals per election district (yellow circles).

6
12
38
Some maps of the June 2020
#NYPrimary
based on
@BOENYC
certified results (thx to
@TweetBenMax
for heads up in
@GothamGazette
about the certified
#s
). First maps:
#NY12
vote share for Rep. Maloney vs Patel, plus share of absentee ballots by ED. 1/n


3
14
36
Hi
@NYCPlanning
, did you know that the Bytes of the Big Apple shapefile of Assembly districts has a "dangling polygon" for AD 53? (version 21B). See screenshot below. I'm assuming this is a mistake. Can you confirm, and also fix it? Thx! cc
@NYCPlanningLabs

2
4
36


Initial map of Dem primary for Lt. Governor in NYC (returns tallied as of 11:30pm). Similar, but different, patterns compared with the governor results.

1
11
35
NYC 2017 mayoral vote mapped by Election District (unofficial returns). Will be talking maps & turnout tonight
@NY1
w/
@errollouis
@RoadToCityHall
@bobhardt
@GradCenterNews
#NYCVotes
Compare w/2013

4
22
34
Based on combining latest (11/9)
@BOENYC
absentee ballot count + in-person votes, 2020 turnout in NYC increased by about 9% (>200K more votes) over 2016. Here's the mapped pattern of change by Assembly District (largest increases on SI & in Qns, much of BK, & parts of MN).

6
9
35
@fordm
No one can "go behind the curtain" to influence your vote, but people can certainly peek to make sure you're voting for you-know-who!

2
9
33
@Redistrict
@bittamostofi
Just ignore the polls (and "needles"). The only "poll" that matters is the vote. The polls create drama where there is none, which is good for media companies desperate for readers/eyeballs, but not good for much else.
1
2
33
0
3
30
One more
#NYPrimary
map for the night, showing vote results from polling sites for
#NY09
. Also without absentee ballots, though it certainly shows a strong pattern for Rep. Clarke.

1
5
34
@jacobkornbluh
@errollouis
Here’s a map of Yang’s vote share by ED in 2020, showing notable support from the Hasidic area of Williamsburg, Crown Hts, and Borough Park (among other areas such as Flushing/NE Queens & Manhattan’s Chinatown). Just FYI. We’ll be posting this soon to our Election Atlas.

0
11
34
"The Battle of the Bases". Three maps in thread below show overlap b/w new NY 12th congressional district & prior 10th & 12th districts. First map shows 2020 primary results (Rep. Nadler to the west of red line; Rep. Maloney to the east). Strongest support for both in UES / UWS.

3
12
29

Yay! I was the first to point out the erroneous vote count difference the other day (on Twitter, anyway), *and* I correctly interpreted this latest difference. Gold stars! 🌟⭐️🌟

4
5
31
@Amy_Siskind
At least Library of Congress is on top of this more than Maher/Esquire for archiving your great work. Thx, I print your list every week!
0
1
27
Initial map of
#NY12
primary results, based on
@BOENYC
unofficial vote totals, 90% reporting. Looks like Rep. Nadler pulled out his base the strongest (see ), and made solid inroads in the UES.

"The Battle of the Bases". Three maps in thread below show overlap b/w new NY 12th congressional district & prior 10th & 12th districts. First map shows 2020 primary results (Rep. Nadler to the west of red line; Rep. Maloney to the east). Strongest support for both in UES / UWS.
3
12
29
0
17
29
We've added 2022 Governor vote share to
@GC_CUNY
Redistricting & You for all congressional plans (current, 2012-2022, etc). Here's comparison of current
#NY03
(table on right) vs 2012-2022 plan (on left) Thx to
@BenJ_Rosenblatt
for compiling the data! 1/2

1
8
29
Some belated maps of
#NY11
(just unofficial in-person results, no absentee). First, 2020: a sharp contrast in vote support on Staten Island b/w the north shore and rest of the island, & mixed results in Brooklyn. 1/3

2
12
29
Embarrassing mea culpa: I put the incorrect year in the title for several of the NY primary maps I posted last night and this morning. It should be *2022@? Thx to
@CKJohnsonBk
for catching it. Corrected
#NY10
maps below. Corrected maps for
#NY12
will be next. Sorry!


3
7
26
@JCColtin
Question: if this is in-person only, why are the first round totals very different from what BOE had published earlier at ? The new citywide first round total is 941,832, which is 142,005 more than the "night-of" result.
1
2
28
Initial results so far in NYC Council district 13 based on unofficial
@BOENYC
returns (as of 10pm), mapped by election district.

3
16
28


@rachelswarns
Sad news. He put me & our voter drive on page A1 I wasn’t quite sure who he was at the time, but I sensed he was a big deal. The photo is on the A train from 59th to 125th. He wanted to take the photo, in his words, on the train Duke Ellington made famous.
0
7
26
@jayrosen_nyu
@agrenell
@mashagessen
@brianstelter
It’s so depressing/infuriating that his response is “Hmm, tell me more.” Either he knows better and just thinks it’s a game, or he’s actually that clueless. Sad.
6
0
26
0
3
27
Updates to
@GC_CUNY
Election Atlas w/maps of
#nycprimary
results for Mayor & Comptroller, including this map of GOP primary. Not as many votes as Dems, but still interesting patterns.
@THECITYNY
@GothamGazette
@CityAndStateNY
@errollouis
@brigidbergin

1
12
26
Update
#NYPrimary
maps for
#NY09
&
#NY12
below. An astute map reader
@NLVWarren
noted that some EDs likely had small turnout. The maps below show
@BOENYC
pollsite results updated as of this morning, & EDs w/fewer than 5 total votes are omitted. Some patterns changed a bit.


1
4
27
NY Senate district 20 (Myrie/Hamilton) election district map based on
@BOENYC
unofficial results, and with
#NY09
district boundaries. Compare with Bunkeddeko/Clark results from June.
#NYPrimary


6
13
27
Turnout in yesterday's
#NYC
Dem primary. Better than average in several high profile Council races, as well as BDB home turf of Park Slope.

4
18
27
Interesting interactive display of NY's new congressional districts from
@HANYScomm
highlighting which communities are new to each district and which are no longer within the new lines, with a focus on which hospitals are in and out of the new districts.

1
4
26
Reposting these two *updated* maps from last night that visualize the
#NYCPublicAdvocate
results by Assembly District.


1
18
25
Big kudos to the NYC Planning Dept's population division for laying the essential groundwork for the 2020 count.

For four years prior to the 2020 Census, DCP added 265,000 housing units missing from the Census Bureau’s list. This resulted in at least 500,000 New Yorkers being enumerated, who would have otherwise been missed. Read more about this feat:
3
25
121
0
5
27
@MikeLydon
The 14th St busway makes 14th St actually appealing. Before the busway, a trip along 14th St was to be dreaded. Now I look forward to shopping, going to the park, farmers market, etc. Makes this slice of NYC just that much more livable.
1
0
25

@darth
And after tmrw everyone can follow their community's progress at our map (eg, ). The chart at the map will rise as Census Bureau publishes real-time response rates. How quickly & how far depends on local efforts! More: Pls share.
0
4
23
Maps below show WFP vote strength in NYC (share of votes for Gov Hochul or AG James on Working Families line). Areas w/highest WFP share also overlap where Wiley, Garcia did well in '21 primary (), Bernie in '16 , de Blasio in '13 etc


0
6
25

@Redistrict
@zach_solomon1
Here's another interactive view (our Redistricting & You site), where you can compare w/current lines & other proposals, and view detailed population/voting data. Here's NY11
3
6
25
@danarubinstein
@WinnHu
Great piece, & such an embarrassment for the mayor. The 14th St Busway is absolutely wonderful. Why would anyone - retailers especially - want to prioritize cars instead of pedestrians (foot traffic for stores) & buses (so more ppl can more easily get to the stores)? We ❤️ buses.
1
0
23
Presidential vote share of in-person votes (unofficial) in NYC, mapped by Assembly District. ADs in blue won by Biden; in red won by Trump. Pie-chart overlay shows returned absentee ballots: size of pie shows relative # of absentee votes; colors show share by party.

2
8
24