

Parker Ross
@Econ_Parker
Followers
13,882
Following
673
Media
3,164
Statuses
5,458
Global Chief Economist @ Arch Capital Group | ex JPM AIG HUD | Husband to Jamie & Dad to Lando & Grey | No investment advice & views are my own 🦬🇺🇸🇮🇱
Darien, CT
Joined May 2009
Don't wanna be here?
Send us removal request.
Explore trending content on Musk Viewer
#FGO
• 448488 Tweets
Félix
• 139257 Tweets
#光る君へ
• 83157 Tweets
エレちゃん
• 79107 Tweets
Carolina Marín
• 70228 Tweets
#Hockey
• 68968 Tweets
エレシュキガル
• 55031 Tweets
NuNew with Aheye
• 54291 Tweets
ビースト
• 52763 Tweets
Lakshya
• 42022 Tweets
#ブラックペアン
• 24862 Tweets
SB19 IS LIMITLESS
• 24360 Tweets
アペンド
• 22012 Tweets
Axelsen
• 18500 Tweets
デスティニー
• 18012 Tweets
Hugo
• 16756 Tweets
サーヴァントコイン
• 14368 Tweets
#だれかtoなかい
• 12733 Tweets
女子バスケ
• 12428 Tweets
ベルギー
• 12148 Tweets
和泉式部
• 11913 Tweets
コマンドー
• 11816 Tweets
Mete Gazoz
• 11697 Tweets


Pinned Tweet

State-level unemployment rates were just released and they continue the string of bad news from the household survey.
It's been a while since I've refreshed this dataset and now my updated state-level Sahm-Rule indicator is really heating back up - in fact, it's now above the

25
196
583
@DeanBaker13
@nytdavidbrooks
@TimAeppel
I’m guessing it’s the $30 double barreled whiskey to blame and not the $25 burger & fries entree + tax & tip🤔
95
82
7K
It's now looking increasingly likely that we're approaching an inflection point for the labor market and the Fed should sit up and take notice.
Key Takeaways from the June Employment Situation Report:
► The trend in private job growth cooled to below its pre-COVID pace with

18
83
358
More evidence to fade the 5.8% 3Q23 GDPNow estimate...
JPMorgan's daily consumer spending tracker through Aug 19 suggests retail sales have decelerated sharply across the board (aside from a surge in spending at gas stations). Control group retail sales are now estimated to have

5
58
244
This is a disturbing double-take from one of the biggest names in economics

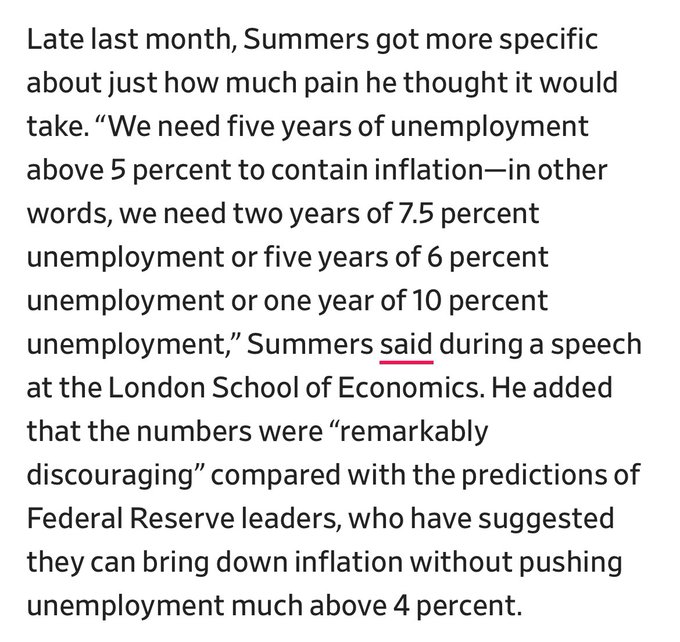
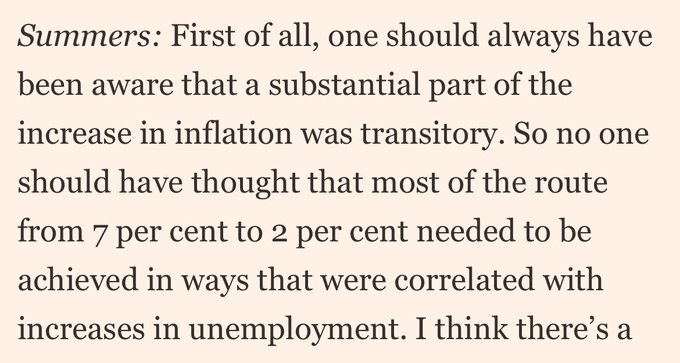
17
29
244
Well... 2s10s is almost un-inverted after today's zoom toward 5% for the 10y.
Only 15bps left before we get to see if this time is different - it's the re-steepening of the yield curve that has traditionally been the harbinger of recessions.
The inversion simply starts the

11
52
240
Pick your poison with today's jobs report, but the net takeaway should be that labor market softening continued through May.
The May employment situation report included much stronger than expected job and wage growth alongside continued deterioration in conditions from the

14
63
241
🚨Something strange is going on with the real-time BEA card spending data 🚨
The BEA data previously tracked the Census data rather well, but something changed over the past few months.
In September & October, the data started rolling over even as the Census Retail Sales and

17
37
233
I had an idea for some analysis, prompted by an interesting post from
@EconBerger
, to look at the composition of the change in unemployment by income levels based on data from the Current Population Survey (CPS).
I was surprised to see that 37bps of the 44bps increase in the

14
53
233
The latest Atlanta Fed wage growth tracker has held steady at 5.2% for the past 3 months ending Dec '23, well above the pre-COVID average of roughly 3.5% and more in-line with the late '90s avg of 5%.
However, if you transform the y/y data into an index and seasonally adjust


Signs of more resilient wage growth?
The
@AtlantaFed
's Wage Growth Tracker held steady at 5.2% for the fourth straight month.
The job switcher series is now up slightly from August at 5.7%


2
11
38
14
46
222
Disappointed to report that the real-time consumer spending data is not looking very robust with most of the September data in hand…
Last week, I noted the rebound from a soft Aug wasn’t looking very convincing. This week even less so.
Based on BEA card spending data through

11
47
213
*POWELL: FED POLICY RATE IS 'WELL INTO RESTRICTIVE TERRITORY'
*POWELL: FED PREPARED TO TIGHTEN MORE IF IT BECOMES APPROPRIATE
*FED'S POWELL: PREMATURE TO SPECULATE ON WHEN POLICY MAY EASE
Market: Got it, rate cuts definitely starting in March!


15
39
206
Quite the morning for the recessionista camp...
1Q GDP revised up to 2% from 1.3% due to stronger than previously reported consumption (4.2% vs 3.8%) and an upward revision to net exports. Core PCE deflator was also revised down to 4.9% from 5.0%.
Claims data also reversed the

9
34
191
Bullard on sticking the soft landing and monetary policy implications:
1) A soft landing (i.e. 2% RGDP + 2% inflation, his definition) looks likely. Ideally want policy rate to be at neutral when economy sticks the landing.
2) Jan CPI is a great example of bumpiness in the

16
39
183
It's starting to become a wild ride in the claims data and most Wall Street economists still haven't caught on for some reason.
Both initial and continuing claims printed well below expectations and below even the lowest economist forecast.
However, both measures of claims were

11
33
163
The May PCE price index came in soft at -0.08% m/m, continuing the string of weak inflation reports for the month.
Core PCE inflation was also soft at 0.08% m/m, down from a slightly upwardly revised 0.26% (0.25% prior).
The breadth of the disinflation was widespread and this

7
41
160
6-month annualized core PCE - the biggest data release for the day - stepped below 2% with aplomb to 1.87% in Nov from 2.34% in Oct.
Mission accomplished?
Well, let's take a look under the hood at what's going on in the 🧵

5
31
155
Household credit stress continued to build in Q3, particularly for credit cards and auto loans, according to the latest NY Fed Household Debt and Credit report.
1⃣ Transition into serious delinquency (i.e. 90+ days) continued to rise for all loan types other than student loans &
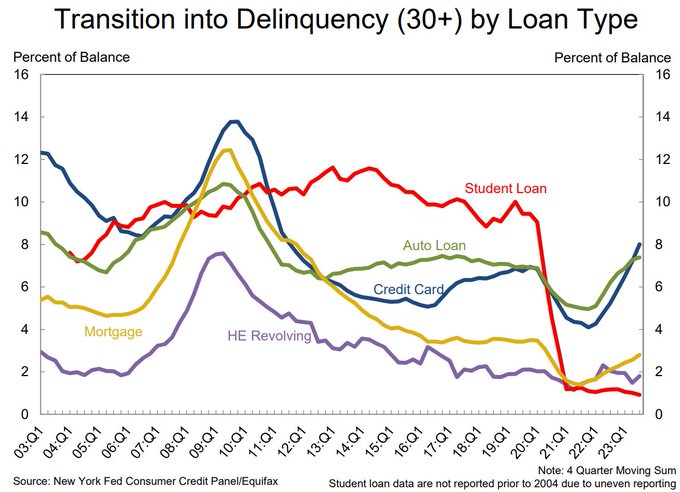


7
47
156
@t0mcoady
@DeanBaker13
@nytdavidbrooks
@TimAeppel
Wow, that's some serious internet sleuthing...
Generally ties out with my quick and dirty mental math + past experiences with airport restaurants
0
0
147
JPM's latest daily consumer spending tracker was just released, with data through July 21st.
Their tracker estimate of control group retail sales suggests a modest acceleration to 0.6% in July, up slightly from 0.5% in June and May.
There's a lot of real-time card data out

2
32
145
Let's reflect on the days when the FRB's H.8 release was awaited by
@CNBCClosingBell
with bated breath, typically with
@BobEUnlimited
on to break it all down for viewers.
Back in the days of yore from late 1Q & early 2Q of 2023, the collapse in all forms of bank lending was

9
21
144
Most interesting takeaway for me from this morning's big bank earnings reports...
Quarterly provisions for credit losses down big at $JPM ($1.4B in 3Q vs $2.9B in 2Q), down a decent amount at $WFC ($1.2B vs $1.7B), and basically unchanged at $1.8B for $C.
Not the type of trends


9
37
145
Is the labor market possibly heating back up?
Noisy numbers around the beginning of the year, but I was again one of the few economists who came close on initial claims, which moved down to 187k from 203k previously (my forecast was 190k vs cons of 205k).
Continuing claims is

12
31
140
And here's where things get interesting...
Initial (231k vs 220k consensus) and continuing jobless claims (1,865k vs 1,843k cons.) both surprised meaningfully to the upside this morning.
However, they both were below the breakeven levels I posted after last week's report: 245k

7
28
140
June ISM Services PMI printed much softer than expected (48.8 vs 52.7 consensus) and is back in contraction territory (i.e. sub-50) after bouncing to 53.8 in May from 49.4 in April.
Smoothing through the monthly noise with a 3-month average, this is the lowest the ISM Services

4
43
138
🚨🚨BEAKING NEWS ON BEA CARD DATA🚨🚨
I just got an update from the BEA economists who work on the near-real-time card spending data regarding the prior data issues I raised a while back:
"We’ve flagged that there were some anomalies in the near-real-time estimates and that we

4
22
132
I've had some great discussions with
@EconBerger
@DannyDayan5
@BobEUnlimited
@SteveMiran
and others recently about the composition of unemployment, which prompted me to dig further into the drivers of the recent increase.
Below is a special cut I created from the Current

11
20
137
A quick 🧵on the latest Daily consumer spending tracker from JPM.
Based on Chase consumer card data through Aug 29, JPM's estimate for Aug control group retail sales is a big step down to -0.49% from a boomy 0.99% in July (Census figure; JPM's estimate for July is 0.79%).

4
44
133
Wow - FOMC statement much more dovish than expected with dots also moving much lower.
10y UST plunging in response.
More in the 🧵

5
32
133
PPI surprised to the upside bigly, which will also lift estimates for the Jan PCE inflation report that will come out at the end of the month.
Combined with this week's hot CPI report, the market is now pricing less than 30% odds of a rate cut in may.
Core PPI surprised even

10
44
132
Wow - big miss for NAHB Housing Market Index, driven lower by the recent spike in mortgage rates. Buyer traffic, present sales, and future sales all took a big step back.
Higher rates have cooled buyer traffic, leading more builders to resort to sales incentives (both price

6
29
128
The February JOLTs data suggests there is still plenty of runway for the labor market.
Job openings inched higher to 8.76m from 8.75m in Feb (8.73m cons), but the more interesting developments are in the hirings and separations data.
If the pace of hiring and separations (i.e.,

6
24
129
You can go ahead and add bank loan growth to the list of indicators supporting the economic slowdown narrative.
Net growth in bank loans & leases decelerated to an average of just $15B over the 4 weeks ending Nov 8, half the pace of late Oct and about a third of the late Aug


4
20
128
Consumer price inflation is still coming in too hot for comfort.
1⃣Monthly headline inflation accelerated to 0.4% in Feb from 0.3% in Jan
2⃣Monthly core inflation was steady at 0.4%
3⃣Annual headline inflation accelerated to 3.2% from 3.1%
4⃣Annual core inflation accelerated

8
33
125
*CITI CEO SEES CRACKS FORMING IN US CONSUMERS WITH LOW FICO SCORES
Lower-FICO consumers likely correlated with the lower-income cohorts that I’ve previously highlighted as being most at risk of credit stress, in part b/c their accumulated pandemic-era savings appear to have

9
17
123
*US RETAIL SALES INCREASED 0.7% IN SEPT.; EST. 0.3%
Wow - talk about an upside surprise... Apparently the card transaction data trended sharply in the opposite direction of reality in September.
Control group retail sales (ex Restaurants & Bars, Auto Dealers, Building


6
31
122
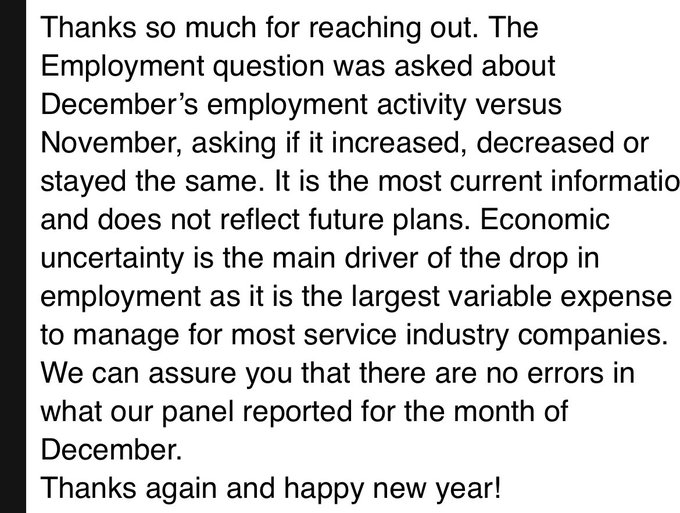
There's certainly something up with the Dec ISM Services Employment print...
But there's been something off with responses to the ISM question about monthly changes in employment since the recovery from COVID got underway.
There's been effectively no correlation between the


The ISM employment plummet was so sharp that I emailed the ISM folks to ensure they check if there is an error. This is their reply. So this really begs the question of why nonfarm payroll increased by that much.
41
91
408
5
28
115
Oct jobs report weaker than expected across the board. The data is about as good as you can get for the Fed.
Accordingly, the bond market was caught offsides 💯 and 10y yields plunged into the 4.50s while odds of another hike in Jan are down to < 20% from > 30% before the

7
29
118
A peek at credit markets in full-blown panic mode....


Credit markets are suddenly painting a less rosy view of the future forward. Yesterday, as stocks plunged and Treasury yields rose, credit spreads also increased. US investment-grade bond yields are now at the highest levels going back to Nov., and edging toward post-2009 highs.

64
414
2K
10
12
121
I have no words...
This recession is just getting ridiculous

6
20
118
Love ya
@BobEUnlimited
but I don't love this very popular chart that keeps popping up in my feed!
I know you're conveying a "respect the lag" sentiment regarding rate hikes, which I fully endorse, but recessions don't typically start shortly after initial claims have been moving


Typical macro cycle turns are slow to start, but they all end in recession.
The current modest rise in unemployment is about median for a year in since YC inversion compared to post-war cycles. But it’s usually in this time frame where things start to get interesting:

86
393
2K
7
14
118
Have your cake and eat it too!
This morning's March jobs report was about as good as it gets: solid growth continued while annual wage growth continued to cool.
1⃣Job growth +303k (cons. 214k)⬆️from 270k in Feb
2⃣Private job growth +232k (170k)⬆️from 207k
3⃣2m-revision to job

15
24
117
One of the best macro proxies from the jobs report is aggregate earnings, which reflects the cooldown in activity toward trend growth since the start of 2024.
Aggregate Earnings = Total Jobs x Average Weekly Hours x Average Hourly Earnings
This effectively gives you a read on


3
31
118
Finally a spicy print for jobless claims, one day after Powell expressed his confidence in the Fed's ability to pivot if unexpected weakness emerges in the labor market.
Initial jobless claims of 242k (sa) during the week ending June 8 surprised to the upside (225k cons, 230k

7
27
116
Buckle up, y'all - state-level unemployment rates just dropped...
My updated state-level
@Claudia_Sahm
rule indicator is heating back up 🔥
Through October, 7 states (i.e., 14% of total in the chart below) had triggered the Sahm Rule, up from just 3 states in September.
New

6
27
113
This chart is awesome and saved me a lot of math.
I had started working on a post to explain the differences between CPI and PCE inflation (and remind everyone that PCE is what matters), but this one chart does a much better job.
The Fed’s communication around inflation will

In practice, 2 dimensions are that they weigh housing and scope health care spending differently; with housing driving CPI much higher.
So arguments for emphasizing CPI boil down to technicals, e.g. we should weigh housing more, or exclude 3rd-party health care payments. /2

3
14
81
6
28
111
Bloomberg's Nowcast for 4Q23 US Real GDP growth has inched back into positive territory after a couple weeks below zero.
That's right - Bloomberg Economics teams' nowcast model saw growth collapsing from >5% in Q3 to contraction in Q4 for a couple weeks.
Bloomberg now sees

7
36
111
Consumer price inflation is still coming in too hot for comfort, largely due to sticky core services inflation.
Shelter, medical care services, and motor vehicle insurance, and motor vehicle maintenance & repairs continued to be the biggest drivers of inflation in March.

7
30
111
*US CONTINUING CLAIMS FELL TO 1,861K LAST WEEK; EST. 1,910K
Odd... Continuing claims were a big miss, lower than all consensus economists.
Good thing I'm not consensus and nailed it again with simple math.
Details of the claims and challenger data in the 🧵

7
18
112
Initial and continuing claims were both much better than expected, suggesting the labor market still has plenty of capacity to keep the expansion going.
Initial claims moved lower to 201k sa (216k consensus) from 213k (revised up from 212k), while continuing claims dropped to

8
25
111
Jan CPI came in hot (both headline & core) - Holding for Longer still in effect.
Core services were the primary driver of the acceleration, contributing 0.40%-pts to the headline figure, lifted particularly by shelter inflation (up 0.6% m/m from 0.4% in Dec).
January is always

7
28
109
*US CONTINUING CLAIMS ROSE TO 1,927K LAST WEEK; EST. 1,865K
*US JOBLESS CLAIMS +7K TO 218K IN NOV 25 WEEK : MNI
Hmm... Who told you we'd get a massive spike and upside surprise for continuing claims this week??? 🤔


Thanks to a smart observation by
@BrettMatsumoto
regarding the timing of Thanksgiving in 2023 vs the pre-COVID years I use in my calculations (i.e. 2017-2019), it looks like we're unlikely to quite get to 2m for continuing claims next week.
Below is the same breakeven charts &

1
2
6
10
14
106
*FED'S LOGAN: HIGHER YIELDS MAY MEAN LESS NEED TO RAISE RATES
Stating the obvious here, but the recent surge in yields and downturn in equities have considerably tightened financial conditions even as the Fed has been on hold since their last hike in late July.
I continue to

7
11
106
Some great thoughts from
@BobEUnlimited
on the "peak yields" for the long end of the rate curve.
Right now, it's truly remarkable what the market is pricing in for the Fed... The "higher for Longer" message has been received: only ~150bps of cuts to ~4% by '25 and then

The challenge with predicting where the long end will peak is that we don't know whether we are in a "high for now" or a new "high for forever" regime.
Policy will determine which path we are on, but we won't know which they will choose for awhile. For now, ambiguity.
36
46
351
8
18
103
Almost like the market somehow knew to discount the hotter-than-expected CPI and wait for the "main show," PPI?

8
10
102
Jobs report update: the world can wait.
I’ve gone dark this week because Disney World needed to happen for my lil dudes.
See everyone next week!

9
2
103
*US WEEKLY JOBLESS CLAIMS AT 205,000 LAST WEEK; EST. 215,000
Initial and continuing claims both came in better than expectations and about 6k better than my forecast for both.
There continue to be no meaningful signs of stress in the claims data.
If anything, the labor market

2
24
100
US Leading Economic Index Fell -0.8% in Oct., Est. -0.7%
This marks the 14th month that the 6m change in the Leading Economic Index has been below the typical magnitude of decline at the onset of prior recessions.
Despite the recent deceleration in the index, the 6m change is


2
13
101
Jobless claims are about to get interesting again...
The new seasonal adjustment factors will continue to put modest upward pressure on the headline figures for initial claims through June and significant downward pressure on continuing claims during the month of April.
The

4
21
101
The headlines for jobless claims remained ho hum, but the underlying trend continued to reflect a deterioration for both initial and continuing claims.
Relative to recent non-COVID impacted years (i.e., 2018-2019 and 2022-2023), non-seasonally adjusted continuing claims have

6
23
100
*US WEEKLY JOBLESS CLAIMS AT 207,000 LAST WEEK; EST. 210,000
The trend in initial jobless claims remains lower, while continuing claims continued rising relative to the pre-COVID norm.
This continues to suggest there has not been an increase in layoffs, but those who are

7
20
100
In the history of the ISM Services Employment index (dating back to 1997) there are only 3 other periods with a larger plunge:
1⃣ Nov '08: Worst monthly job losses of GFC
2⃣ Feb '14: Severe winter storms pinched job growth
3⃣ Mar-Apr '20: Pandemic Lockdowns
This certainly bears

25
23
87
Job growth and unemployment trending higher!
Let's dig in:
1⃣ Job growth +275k (cons. 200k)⬆️from 229k in Jan
2⃣Private job growth +223k (165k)⬆️from 177k
3⃣2m-revision to job growth -167k
4⃣ U-Rate⬆️to 3.9% (3.7%) from 3.7%
5⃣ AHE m/m⬇️to +0.1% (0.2%) from 0.5%
6⃣ AHE y/y +4.3%

6
24
98
Solid data across the board again this morning but still not enough for the Fed to cut in March.
Dec PCE headline inflation came in 2.01% annualized over the past 6 months and up 2.6% y/y, matching consensus.
Meanwhile, Core PCE inflation was up 1.86% annualized over the past 6

7
19
96
Mortgage rates aren't likely to move meaningfully lower over the 2nd half of 2024, even if the Fed starts cutting rates in September as the market currently expects.
That's because markets are already pricing in roughly 6 rate cuts over the next year, with most of those

9
14
102
The Conference Board's Leading Economic Index contracted again in Nov for the 20th consecutive month (-0.5%).
The pace of the decline was an improvement from the -1.0% decline in Oct and -0.8% in Sep.
More importantly, the 6m change also continued to improve, up to -3.5% from

5
18
90
BEA real card spending data (deflated by PCE) with partial data through the first week of June showed a sharp rebound in from the downturn in March / April.
JPM suggests its card spending data reflects real control group retail sales growth of 0.45% m/m in May, while BofA


BofA: Card spending was generally solid in May

1
3
15
3
22
89
*US REVISED 4Q CORE CPI UNCHANGED AT 3.3% ANNUALIZED INCREASE
Exciting stuff folks, glad we did all that hand-wringing...

4
16
89

“Highest level ever recorded going back to 2006”
1980s: Hold my 🍺

The median American household needed 44% of its income to cover annual payments on a median-priced home as of July: Atlanta Fed data. That was the highest level ever recorded in data going back to 2006.
33
167
488
8
15
88
I really can't find any positive spin here other than to disregard some of the data, which I'm certainly not inclined to do...
I've been calling out weakness in Sep retail consumer spending on top of the already weak Aug for a few weeks now. With another week of data in hand,

7
20
85
Consumer price index (CPI) inflation cooled even further in June, following an already surprisingly soft print in May.
The last two prints have been such a sharp divergence from the preceding months that the Fed will likely want to see one more print before gaining enough

7
17
86
Unfortunately real-time consumer spending data continued to look anything but robust for the month of September…
Last week, I called out weakness in Sep on top of the already weak Aug. With another week of data in hand, that still seems to be the case.
Based on BEA card

5
9
86
Amazing how much the monthly pace of inflation can cool when auto insurance isn't adding more than 0.20%-pts to Supercore (which it did for 8 of the last 9 months)...
In fact, an acceleration in shelter inflation to 0.40% in May from 0.38% in April was the only thing keeping

5
26
85
Finally digging out of the work that piled up during my time away...
I've been refreshing some of my dashboards for last week's data and was surprised by the Jan '24 spike in the Challenger Layoffs data.
While the headline figure was down -20% y/y, that was mostly due to base

6
22
84
Here's a look at the 20 states that have breached the Sahm-rule threshold for a recession.
Important to note that the Sahm-rule was not trained on state-level unemployment rates, but you can see in my chart at the top that it mimics the national-level version well.

3
14
83
The wheels are down and we're still rolling with plenty of runway.
Quick Summary:
1⃣ Job growth +199k (cons. 185k)⬆️from 150k in Oct
2⃣Private job growth +150k (159k)⬆️from 85k
3⃣2m revision to job growth -35k
4⃣ U-Rate⬇️to 3.7% (3.9%) from 3.9%
5⃣ AHE m/m +0.4% (0.3%)⬆️from

2
19
81
Big if true


@federalreserve
announces that the Bank Term Funding Program (BTFP) will cease making new loans as scheduled on March 11:
166
475
1K
5
21
82
The 3Q SLOOS just dropped!
Quick reaction: headlines better than expected and reflect some modest normalization of lending standards outside of residential real estate.
The net share tightening is still quite extreme, but we may have reached peak tightening for this cycle


Now available: quarterly survey on bank lending practices covering bank loans to businesses and households:
7
27
64
4
21
79
The claims data is starting to get interesting again...
Both initial and continuing claims surprised to the upside, just as I called out as my expectation (see link below).
Interestingly, the unadjusted continuing claims data is starting to roll over vs its pre-COVID average

3
15
80
With the Census Retail Sales report tomorrow, I figured it's a good time to provide a 🧵on the latest JPM / BEA / BofA card transaction data.
Hope everyone is ready for some whiplash - it looks like the Aug slowdown was likely payback for the hot July print and Sep is shaping up

2
14
79
Pretty impressive jobless claims report this morning.
Initial claims down big and continuing claims still trending down on a seasonally adjusted (sa) basis.
However, the divergence continued between the sa and non-seasonally adjusted (nsa) continuing claims, which trended

7
19
76
BofA's latest Consumer Checkpoint shows median household savings & checking balances have declined slightly over the past year but remain up 40%+ vs 2019 levels across all income cohorts

8
19
77
Although the May Job Openings and Labor Turnover Survey (JOLTS) showed slightly more job openings than expected (8.14m vs 7.95m consensus), the broader underlying downtrends remained in place.
The pace of hiring continued to cool, but so did the pace of separations (e.g.,

1
20
76
Long list of data releases this morning, with the net mix skewing positive. The economy appears on track for solid momentum to carry over into 1Q24.
Jobless claims were one of the weaker data releases as initial and continuing claims rose more than my forecasts and consensus,

3
15
75
Consumer price inflation cooled but was still hotter than the Fed would like in April due to sticky core services inflation, with Owners' Equivalent Rent (OER) the key fly in the ointment.
Shelter, medical care services, and motor vehicle insurance continued to be the biggest

5
19
76
We are so back!
Net growth in bank loans & leases accelerated to an average of $29B over the 4 weeks ending Oct 25, led by Commercial & Industrial loans (+$15B).
In reality, most of the other categories showed tepid growth or even a contraction, aside from Other Loans & Leases


5
18
74
Big historical revisions to continuing jobless claims this week due to the implementation of a new seasonal adjustment methodology, with more modest impacts to the initial claims data.
After the revisions, my initial reaction is I like the new approach much better than the

2
14
76
Seasonally adjusted jobless claims remained pretty boring, but the unadjusted data continued to deteriorate relative to typical seasonal patterns.
Relative to recent non-COVID impacted years (i.e., 2018-2019 and 2022-2023), non-seasonally adjusted continuing claims have been

5
6
73
*MOYNIHAN: CONSUMER SPENT 4.5% MORE THIS SEPTEMBER VS LAST SEPTEMBER
Either consumers came roaring back over the second half of Sep or this is the clearest signal to not take the BofA card spending data seriously...
More on this tomorrow when I'll share my regular weekly update

18
16
71
Quick update on retail card spending with less commentary than usual...
General takeaway is that real-time spending measures appear to have rebounded a bit in October after massively undershooting the Census data.
JPM estimates control group retail sales climbed another 0.57%

5
14
71
I still can’t believe 7,000+ people have chosen to “follow” my rambling threads on here.
It’s been a surprisingly enjoyable experience and I’ve met some great people on here that I never would’ve connected with otherwise.
Thanks to all for the support / feedback / challenge /

13
3
70
*US CONTINUING CLAIMS ROSE TO 1,790K LAST WEEK; EST. 1,740K
Seasonally adjusted continuing claims really moving higher now, just like I've been shouting from the rooftops about since early this year...
Maybe some of the street economists will start listening, but they certainly

5
19
72
Retail sales took a bigger than usual step down from December in January, with total (-0.8% m/m vs -0.2% cons) and control group (-0.4% vs 0.2% cons) coming in well below expectations.
Growth in control group sales was also revised down in November (0.19% vs 0.47% prior) and

3
12
71
Initial jobless claims spiked 20k the week after the Independence Day holiday, which always introduces noise into the weekly data.
I did some analysis on the weekly growth in the non-seasonally adjusted (NSA) initial claims data, and the prior weeks' decline was unusual for


6
14
70
Today is the day for my monthly reminder that while the streak of negative revisions to nonfarm payrolls is interesting, the magnitude of the revisions isn’t that significant compared with the distribution of historical revisions...


Nonfarm payrolls have been revised lower for seven consecutive months.
June has been revised lower by 104k from the first release to the current data.
1/3

12
105
421
3
20
69
The housing slowdown continued through June based on the latest data from NAR, suggesting home price growth will cool further over the second half of 2024 even as home prices remained near a record high.
Many more details from the report in the 🧵

2
22
72
May producer prices plunged to a -0.25% m/m decline from a 0.52% m/m gain in April.
This suggests the big cooldown in May CPI wasn't a fluke / just noise and sets us up for a soft May PCE print later this month.
1⃣Services became a modest drag (-0.009%-pts) on monthly PPI

2
14
70
The trend in initial jobless claims remains lower, while continuing claims continued rising relative to the pre-COVID norm.
This suggests there has not been an increase in businesses laying off workers, but those who are unemployed are finding it more challenging to secure a

4
15
68
We're still rolling and appear to have plenty of runway ahead.
Quick Summary:
1⃣ Job growth +216k (cons. 175k)⬆️from 173k in Nov
2⃣Private job growth +164k (130k)⬆️from 136k
3⃣2m-revision to job growth -71k
4⃣ U-Rate↔️at 3.7% (3.8%)
5⃣ AHE m/m ↔️ at +0.4% (0.3%)
6⃣ AHE y/y +4.1%

6
16
65