

Topi Tjukanov
@tjukanov
Followers
20,898
Following
2,429
Media
1,345
Statuses
9,594
Makes maps. Works at @Mapbox . Started #30DayMapChallenge .
Helsinki, Suomi
Joined November 2013
Don't wanna be here?
Send us removal request.
Explore trending content on Musk Viewer
Internacional
• 116292 Tweets
Karol G
• 106194 Tweets
土用の丑の日
• 59450 Tweets
ゲリラ豪雨
• 39272 Tweets
デッドプール
• 36779 Tweets
Ingat
• 32585 Tweets
Mets
• 32548 Tweets
Saint Dr MSG Insan
• 28135 Tweets
ジェシー
• 27300 Tweets
Guru Purnima Celebration
• 26643 Tweets
#CarinaPH
• 24528 Tweets
O Inter
• 20777 Tweets
Toy Bank
• 19670 Tweets
Renê
• 17451 Tweets
Boone
• 10732 Tweets
Last Seen Profiles


8 hours of flight traffic over Europe animated. Looks quite busy, doesn't it?
Animated with
#QGIS
. Data from
@flightradar24
56
882
2K
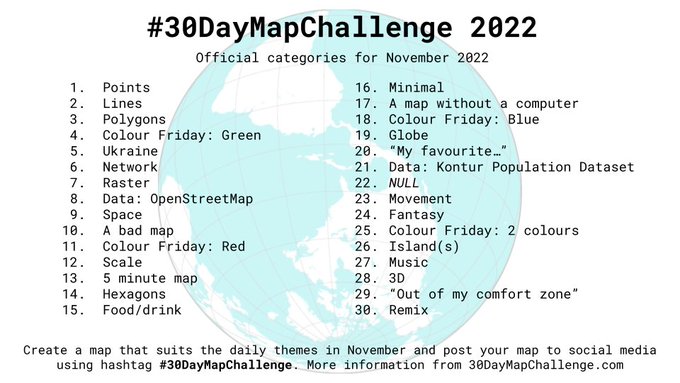
#30DayMapChallenge
categories for 2022 are here! 🎉
Daily open map challenge happening in November. No restriction on tools or data. No need to register anywhere. Just an excuse to make maps and admire maps made by others 🌎🌎🌎
26
431
1K
Animation showing how
#Amsterdam
has grown during the last 200 years. Buildings appear on the map on the year when they were built.
Data:
12
443
1K
Baltic Sea traffic visualized. Version 3.0.
- 24 hours of data
- Ships are colored based on their home country ⛴️
15
477
1K
High(er) resolution version of Helsinki region public transport on a normal Monday afternoon from the
@HSLdevcom
API
Yellow = Tram 🚋
Blue = Train 🚂
Pink = Bus 🚎
16
284
1K
A map of Finland. In the blue areas the distance to the closest lake is less than 1 kilometer.
Data:
@Maanmittaus
, analysis: me + GDAL.

10
188
946
🎉Categories for
#30DayMapChallenge
2021 🎉
Join in to create maps around these themes. Use your creativity and share your results with others! Starts 01/11/2021.
More information:

19
340
922
#30DayMapChallenge
2020 categories are here. Starting November 1st! 🎉🎉
Publish a map each day with the following themes. No restriction on tools or data, but all maps should be made by you. Doing less than 30 is fine too.
More info::

26
294
774
Announcing
#30DayMapChallenge
in November 2019! Create a map each day of the month with the following themes 🌍🌎🌏
No restriction on tools. All maps should be created by you. Doing less than 30 maps is fine.
#gischat
#geography
#cartography
#dataviz

33
281
760
Helsinki bubbling public transportation using live data from yesterday afternoon. Update to the old version now with metro locations included.
Blue = 🚃
Green = 🚂
Pink = 🚋
Yellow = 🚇
22
160
710
#30DayMapChallenge
2023 themes are here for November🌎
Main guidelines: have fun, get inspired by beautiful maps, try to learn new things and support others!

24
218
678
Finally I have a portfolio online showcasing what I've been doing lately with lines, points and polygons. Check it out and let me know what you think!
You can find the site at
15
150
663


I did a spatial analysis. Which is the closest neighboring country in different parts of Finland.
For no particular reason.

20
77
563

Average mobile connection download speeds around Europe. Based on
@Speedtest
data aggregated to a larger hexagon grid.
#30DayMapChallenge
. Day 15: connections

18
131
493
One week of train traffic in Finland (4,5 million GPS points) compressed into one small animation. The color and size of the points change with the speed of the train.
8
222
471


15 minute (!) snapshot of public transport around Helsinki this morning. Created with
@HSLdevcom
data.
Each dot is a bus, train or a tram. To give it a more dynamic look, the size changes slightly according to speed.
13
149
448
Finished version. How much area you can cover by car in one hour? A comparison between European capitals.

20
188
421
The map about notable people went viral like no other map I've done before. Here's a thread 🧵

12
63
404
Nighttime lights? Nope. It's aggregated mobile Internet speeds from the
@Speedtest
data. Work in progress.

14
90
393
Global access to Internet mapped based on the
@Speedtest
data. Brighter colors indicate faster connections.
#30DayMapChallenge
day 7: green

24
102
380
I published the pre-trained
#StyleGAN2
network pickle I created for
#mapdreamer
.
You can download it here:
Blog about the process:
7
84
380

Finnish population cartogram. Shows pretty well how unevenly the country is populated.
7
145
374
Refugees and asylum-seekers who have died or gone missing in the process of migration towards Europe between 2014 and 2020. A minimum estimate, as many deaths during migration go unrecorded.
Data:
@MissingMigrants
//
@IOM_GMDAC
7
400
364
All roads lead to
#Helsinki
. Shortest route to Helsinki from all postal codes in Finland. Inspired by
@moovelLab
, data from
@graphhopper
API

8
144
347
Ultimate 'Nearest Neighbour Analysis' is now complete! Which is your closest neighboring country (anyhwere on the globe)?
View the interactive map here 👇🏼👇🏼👇🏼
Or make a better version with the data:
12
107
325

Dear Twitter friends. Some personal news. On Saturday we became the proud parents of the most beautiful baby girl with
@nina_tjukanov
👶🏼
45
2
324
I just published Places and their names — observations from 11 million place names

17
118
319
#30DayMapChallenge
1. Points
One tiny point per 10 people found from the
@EU_Eurostat
population grid.

10
54
314

Elevation around South America rendered using ETOPO1 data with
#Aerialod
.
#30DayMapChallenge
day 8: yellow.

5
46
298
2020 version of 'Most common words in (all) place names describing nature in the US'

10
65
293
Finally managed to update my personal website. Still needs a few tweaks, but definitely better than before:
🌎
10
31
285


Twitter bot idea: random images from Wikipedia reprojected to web mercator.

5
23
282
Highly important. Ratio between people and pigs in Finland in each municipality..

14
88
261
#30DayMapChallenge
Day 1: Points representing windfarms around the globe. Point size == capacity.
Data: Global Wind Power Tracker, Global Energy Monitor, May 2022 release

5
29
264


One more of my
@unfoldedinc
Studio experiments: 1.6 million GPS records of high-altitude flights of Himalayan vultures visualized in 3D:
8
55
250


Baltic Sea traffic visualized version 2.0. This time with 12 hours of data.
4
103
245
For some people cartography seems to be like classical music. Strict rules how to do things. If you’re not qualified, don’t do it.
For me cartography is like punk. If you’ve found the instruments, just fucking play.
11
32
243
All the buildings in San Francisco in QGIS
#qlimt
style.
#30DayMapChallenge
Day 3: polygons.

4
19
234
#30DayMapChallenge
2021 Day 1: Points
All parking tickets issued in Helsinki 2014-2021. About 1.5 million points. Data from
@HelsinkiKymp
:

4
28
235

#QGIS
has a new feature called Temporal Controller.
I wrote a pretty extensive blog post on how to make animated maps with QGIS in 2020:
#geogiffery
3
54
226
Individual trees as open data. This kind of datasets never stop to amaze me. This one is Toronto:

8
31
229
Ok... So I did a few more vintage isochrones from some very different cities. 5½ hours of travel looks very different in Chicago, Cairo, Mumbai, Mexico City and Tromsø.
Full sized maps on my website:
7
60
227

Our project at
@gispofinland
for
@GrowthZoneFi
is out now completely!
Regional indicators, live traffic data and mobile location data visualized with
#KeplerGL
👇🏼


9
47
219
Routes from San Francisco to everywhere in the West U.S.
Surprised how much this resembles the ones I've done earlier from Europe.
3
92
219

ETOPO-1 + Sentinel-2 processed with
#QGIS
+
#Blender
. Combining my learnings from the excellent Blender tutorials by
@klaskarlsson
&
@pinakographos
.

2
24
218
Population change in southern Finland between 2005 and 2018. In the red 1 x 1 km squares population has decreased with more than five people and in the yellow squares there has been similar increase.
#30DayMapChallenge
Day 23: population.

2
48
212
Finally the tutorial is online! I wrote a small blog on how to do animated routes with QGIS:
3
69
214

Kansan kuva. Analysoin ja yhdistin parilla rivillä koodia kaikkien kansanedustajien kasvokuvat. Tältä näyttävät siis
#kansanedustajat
keskimäärin. Tämä naama herättää minussa valtaisaa luottamusta.

13
67
210

#30DayMapChallenge
day 5: OpenStreetMap
A map of
#Tampere
, using the excellent prettymaps Python notebooks.
Find prettymaps here:

3
18
200
A data visualization suitable for
#ValentinesDay
. 24 hour traffic isochrone heartbeat from the U.S. Who can name all the cities?
10
81
198
What is on the other side of the globe? In case you are thinking about digging a long tunnel, this shows where you would end up.

6
42
201
U.S. urban forms. How much land area you can cover by car in one hour. The circle around each city is 30 miles from starting point in city center. European version + more info:

2
63
199
Data visualization from +100 years ago showing the value of industrial production in different sectors in Finland.

3
61
195
More typographic experiments with Danish ship data.
- 24 hours of ship traffic
- Size of ship name defined by a combination of vessel size and speed
- Direction of the name is defined by vessel's course
5
78
194
How much does coordinate precision matter? Do you REALLY need those 15 decimals in your GeoJSON? Same location expressed with 0, 1, 2, 3, 4 and 5 decimals in WGS84 -->

14
51
195


I recently came across (HT
@vpkivimaki
) the National Archives collection of thousands of declassified CIA maps:
I made a thread about few maps which I found interesting from cartographic perspective
(1/n) 👇👇👇
2
51
189
Sunday visualization experiments:
- 24 hours of traffic through Danish straits on December 1st
- Bigger the ship name on the map, bigger the ship in real life
#QGIS
#OpenData
#UselessDataviz
#DataIsBeautiful
9
70
192
Came across this piece of data by accident (sic) and just had to make a map out of it: if you have a vehicle accident in Finland, what animal are you most likely to hit in different parts of the country.

8
35
188
If you are in Denmark and want to get as far away from buildings as possible, this is the most isolated point 🇩🇰. It is located between Klitmøller and Hanstholm and is 4,4 kilometers from the closest building.
#QGIS
#solitudespot

11
43
186
Seuraa äärimmäisen tärkeä tiedote: Suomessa on 569 paikannimeä joiden nimeen sisältyy sana paska.

8
87
186
Buildings in Madrid 🇪🇸. Darker the shade of red, older the building.
Day 7 of
#30DayMapChallenge
.

4
29
183
Q: "Is the data stored in a database?"
A: "Yes."
Q: "What kind of a database?
A: "A Word document."
9
41
178


5½ hour drive time isochrones from Frankfurt. Amazing how many major cities in Europe can be reached in this time.
I just had to do another one and add it to my portfolio:

8
45
177
Where to find your zen? The most isolated point in Great Britain is located in Scotland and is 7.8 kilometers from the closest building. Here's a collection of 10 isolated points around GB 🇬🇧
For further information check:
7
52
175