

Willie Delwiche, CMT, CFA
@WillieDelwiche
Followers
21,967
Following
291
Media
5,735
Statuses
22,312
@HiMountResearch founder | Teaching Econ/Finance at @insidewlc | Urban farmer & vintner All models are wrong - some are useful
Milwaukee, WI
Joined September 2013
Don't wanna be here?
Send us removal request.
Explore trending content on Musk Viewer
The U
• 631794 Tweets
#TGS2024
• 181335 Tweets
Miami
• 97891 Tweets
Washington
• 87428 Tweets
Knicks
• 79998 Tweets
Towns
• 71153 Tweets
Minnesota
• 68952 Tweets
León
• 64720 Tweets
Randle
• 60155 Tweets
Donte
• 38449 Tweets
Wolves
• 37973 Tweets
भगत सिंह
• 36891 Tweets
The ACC
• 29197 Tweets
#DAY6INBKK2024
• 28648 Tweets
Asharamji Bapu Case
• 26409 Tweets
Equality Exploited
• 24217 Tweets
Hart
• 22829 Tweets
日本破壊クソメガネ
• 19629 Tweets
Virginia Tech
• 18445 Tweets
Cam Ward
• 18291 Tweets
Canes
• 14294 Tweets
Rutgers
• 12511 Tweets
Celtics
• 11867 Tweets


Pinned Tweet

If you are paying attention to everything, you are focusing on nothing.
5
12
118
We've never before had so few stocks outperforming the S&P 500.

31
295
1K
This is Unprecedented:
We’ve had bonds down for 3 quarters in a row in the past & we’ve had stocks down for 3 (or more) in a row.
But we have never had stocks & bonds both down in 3 consecutive quarters.
Until now.

59
289
1K
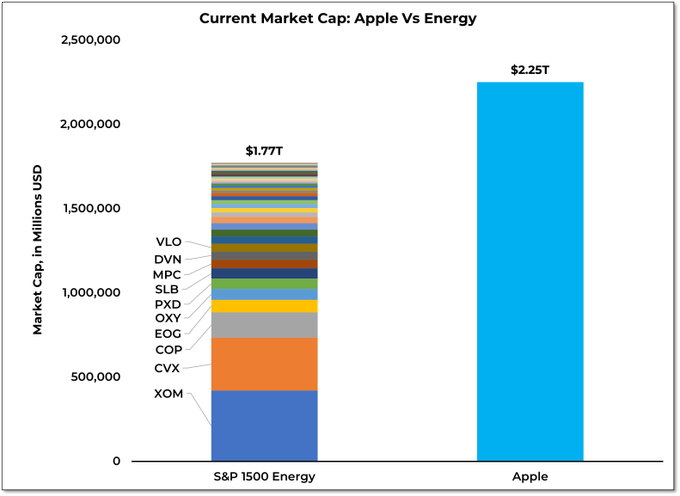
Apple has a larger market cap than all the Energy stocks in the S&P 1500 combined.
81
198
937
Marty Zweig's rules.
If you are going to quote them - know them.
Ignore them at your peril.

23
249
903
Investors are fighting the trend: $ARKK is down 60% YTD and has seen net inflows of $1 billion. $XLE is up 40% YTD and has had net outflows.

44
132
685

Stocks have been despised all year and yet remain historically over-owned.
If past is prologue, that's a recipe for a secular bear market and a lost decade of equity market returns.

37
151
639

CBOE equity put/call ratio had never before been above 1.5.
Yesterday it was above 2.0.

40
133
528
Bull markets: “It’s a great stock”
Bear markets: “It’s a great company”
16
58
507
Cash is running 12% ahead of $SPX so far this year.
29
32
501
If all I had were market indicators, I’d probably be leveraged long.
If all I had were macro indicators, I’d be net short.
34
36
449
Biggest mistake being made right now is assuming the bull market is still intact.
57
36
383
There is a yawning chasm between what people are saying & what they are doing.

29
68
396
It's never not been a recession when the Philly Fed Index has been as low as it is right now.

32
107
380
When equity market sentiment got washed out in 1990, 2003 and 2008, stock exposure approached 40% from above and cash exposure approached 40% from below.

16
95
372
Investors might be bearish, but they still haven't done much about it.
Positioning matters more than sentiment.

11
73
338
Last week's breadth thrust decreases the odds of this continuing, but recent $SPX price action remains eerily consistent with 2007-09.

19
68
299
2022 is not 2008 - but you might not realize that just by looking at the price action.

18
71
298
We have a Risk On backdrop for the first time in a year.

21
62
288
A pullback is when your neighbor's portfolio is down 20%.
A bear market is when yours is down 20%.
3
29
281
Bull markets take you to levels you never thought you would see.
Bear markets take you to levels you never thought you would see again.
1
61
266
55 days in a row (and counting) of more new lows than new highs.
That is not bull market behavior.

8
61
257
This year:
If you bought S&P 500 when VIX closed above 28.5 and sold when it dropped below 28.5, you'd be up 13% YTD.
If you bought when it dropped below 28.5 and sold after it closed above 28.5, you'd be down 30% YTD.

8
60
258
Just over 55% of $SPX closed at new 20-day highs yesterday.
That triggers a breadth thrust in our work - the first since June 2020.

12
64
227
71 days in a row of more new lows than new highs on NASDAQ.
Matches the Dec 2008 peak with a chance for the record tomorrow.

5
52
230
This one surprised me:
Even for the Magnificent Seven it's been two years with no progress.

17
44
219
A little more on yesterday's spike in NASDAQ new lows:
20+ years of daily data and we've never seen more stocks making new 52-week lows on the same day that the NASDAQ Composite was making a new 52-week high.

9
56
213
Decentralization was supposed to make things more transparent not more opaque.

FTX Corporate Structure - AKA the world's greatest shell game. Nothing to hide.

334
1K
4K
21
42
194
Previous instances over past 40+ years when % of $SPX stocks at 20-day highs exceeded 55%.
Nothing's certain (see 2002), but odds of further upside seem to be improving.

7
54
189
NASDAQ getting headlines for its YTD gains.
Beneath the surface, it's more new lows than new highs as breadth deteriorates.

9
46
187

Stocks don't usually suffer after persistent pessimism fades.

5
45
186
For evidence that a bear market is over, I want to see:
1. New lows contract
2. New highs expand
AND
3. New highs > new lows
So far we're seeing a lot of 1, a little of 2, but none of 3.

12
33
181
Since 2000, the VIX has closed above 28.5 just 12% of the time.
But when the VIX has been that high, the S&P 500 has produced an annualized return of greater than 40% (vs an annualized return of less than 1% when the VIX has been below 28.5).
Fade fear.

0
35
171
Buying panic among NAAIM members: median exposure (up to 45% from 1.25%) posted second largest weekly increase in history of survey.

10
38
162
34 weeks in a row of more stocks making new lows than new highs.

5
29
160
NDR Trading Sentiment Composite is at its lowest level since late-2022.
When short-term sentiment is this washed out, stocks usually rip.

7
46
162
Currently at 6 days in a row of more decliners than advancers on the S&P 500. That's the longest streak this year and tied for the longest since Dec 2018.

12
37
150
When new lows > new highs, talk of a new bull market is premature and expecting price bounces to persist is defying history.

13
35
151
Momentum thrusts without breadth thrusts can point to exhaustion.
But when seen with breadth thrusts, they've led to rallies that haven't looked back.

7
25
153
In taking out its 2018 high, 10-year T-Note yield has surpassed the previous cycle peak for the first time in 40+ years.

6
45
147
NASDAQ Composite ekes out a new high on the same day that NASDAQ new low list reaches highest level since March 2020.

8
30
139
2022 is looking awfully similar to 2008 in terms of the relationship between volatility and strength (or the lack there of).

4
39
142
Plot thickens as II bull-bear spread collapses. Getting close to bears > bulls on this survey.

4
36
141
Commodities have joined stocks and bonds in down trends.
Stage VI of Martin Pring's cycle.
Next is back to Stage I, when bonds turn higher.

5
36
137
Half of issues on NYSE+NASDAQ made new 52-week lows last week.
If that was exhaustive, then we should soon see the new low list collapse and end the 25 week run of new lows > new highs.

3
29
133
We are in the midst of the longest stretch of consecutive days of more new lows than new highs since the 2008/09 financial crisis.

6
36
130
1000 more stocks made new lows than made new highs yesterday.
Yet the pundits keep talking about "Year 2 of a Bull Market"

12
39
129
2022 is again the worst start in past quarter century for 60/40 portfolio.

7
38
128
50 years of trade offs between strength & volatility.
Only years comparable to 2022 are 2008 & 1974.

6
46
126
AAII bears jumped to highest level since Mar 2009 and are above 60% for only the 4th time in the history of the survey.

8
33
125
Energy sector: up 50% YTD.
Impact on S&P 500: negligible.

6
19
125
Dec 2018 looks like a cyclical low, meaning we are only a year or so into the current bull market. Mythbusting courtesy of
@Todd_Sohn
via yesterday's
@CMTAssociation
webinar.

5
40
120
For all the talk about rampant pessimism, retail still loves stocks.
Household equity exposure remained above its long-term average all of last year and has increased over the past two months.

12
37
125
S&P 500 being up 15% or more in 40 days tends to lead to more gains.
Strength begets strength.

7
32
121
A correction is when your neighbor is down 20% in the market. A bear market is when you're down 20%.
2
17
123
All the net gains for S&P 500 since 2000 have come with VIX > 28.5.
That leaves you with 87% of your time to go fishing.

7
21
121
It is hard (for me at least) to look at this fund flow data and conclude that there was not at least some degree of panic that occurred in December - Equity funds had outflows of nearly $100 billion over the past four weeks.

5
62
117
Payrolls & unemployment rates don't tell much about where the economy is headed.
Average weekly hours are the only part of today's employment report considered a leading indicator.
Decline there has accelerated in recent months.
Not looking very soft landing-ish.

4
28
118
AAII bears drop below 20% for the first time in 2.5 years and are at their lowest level since early 2018.

9
44
122
New highs > new lows for the first time this year.

2
38
122
Sentiment on gold has completely reversed from where it was this summer (when gold was hitting new all time highs). Pessimism at its most extreme since Aug 2018 (when gold was at $1200/oz). $GLD

10
33
115
Amazing how many things that made some sense at 0% rates make no sense at 4% rates.
Almost as if the cost of capital is an important input.
5
12
118
After today, NASDAQ Composite is ~6% of its peak. More than 2/3 of its stocks are at least 20% below their highs and nearly 40% have been cut in half.

9
32
118
The last time we had more new highs than lows on a weekly basis was 11/19/21. That was 700 $SPX points (17%) ago.

4
21
115
Plenty of focus on Emerging Markets ($EEM) finally surpassing the 2007 peak last week. Think its equally important to look at it relative to S&P 500 ($SPY) where a reversal of a decade-long downtrend appears to have only just begun.

2
40
116
Now at 29 consecutive weeks of new lows > new highs and some still stubbornly refuse to call it a bear market.

1
36
116
If it's not a recession, it's unprecedented.

16
35
114
Another spike to a new high for the CBOE equity put/call ratio.

14
28
115
48% of trading days in 2022 saw a 1% swing on the S&P 500 & 92% had new lows > new highs.
Going back 5+ decades, that was an unprecedented combination of volatility & weakness.

4
32
115
Lots of focus on the S&P 500 & it's 200-day average in recent days.
Over the past couple of decades, whether the average is rising or falling has mattered a lot more than whether the index is above or below it.

4
16
110
Based on Philly Fed new orders indexes (current and future), avoiding recession would be unprecedented.

1
32
108
We are searching for truth, but what we find is perspective.
Where you look determines what you see.

3
31
111
Everything has been down more than the S&P 500 this year.

6
16
108
50% of days in 2022 have had the S&P 500 move +/-1% or more.
Fewer than 10% of days have seen new highs > new lows.
Strength & volatility tend to be inversely correlated over time.
When market trend turns higher, it should be volatility down and strength up.

7
20
109
If the patterns of history hold, we are likely to see a bull market in bonds before we see a bull market in stocks.
Right now, it's persistent downtrends in bonds, stocks and commodities.

4
27
108
Today was the 8th day in a row with new lows > new highs and the S&P 500 moving less than 1%. That’s the longest stretch since 2018 and fifth longest in the past quarter century.
Persistently quiet weakness is a market anomaly.

2
32
109
If you're looking for market rallies to be sustained while more stocks are making new lows than new highs (which is currently the case), you’re fighting the tape.

12
21
109
NYSE+NASDAQ last week:
more stocks were down than up & more made new lows than new highs.
If it’s a bull market, it’s a weird one.

8
26
109
No need to overthink or overreact to specific $SPX levels.
We continue to see new highs > new lows (27 days in a row is longest stretch since mid-2021) and that is bull market behavior.

12
21
107
Friday's 9-to-1 up day was followed by a 14-to-1 up day yesterday.
Argues that downside momentum has been broken and puts our bull market re-birth checklist now at 1 out of 5.

7
26
106
Finishing the week with VIX < 28.5 and net new high A/D line still falling.
That leaves our VIX-Breadth Tactical Model with a negative reading.
Since 1990 that has been case 25% of the time, during which the S&P 500 has lost 40% of its value.

6
27
106
More bear markets end in October than in any other month.
Most bear markets do not end in October.
10
12
103
Bond yield breakout has been a global phenomenon.

1
40
102
Ford - Tesla relationship at an interesting juncture that goes beyond just suburbanite truck preferences. (chart courtesy of
@sstrazza
) $F $TSLA

8
26
100
We are coming out of the most protracted period of pessimism in the history of the AAII survey.
When persistent pessimism has faded in the past, it's usually been good news for stocks.

6
35
106
Do stocks typically rally this time of year (especially heading into mid-term elections)? Yeah.
Does everybody already know this? Also yeah.

10
27
105
We’re at 7 days in a row without a 1% swing in the S&P 500 - that matches the longest such stretch we’ve seen since Nov 2021.
Bear markets are characterized by day-to-day price volatility. Bull markets are characterized by extended periods of relative calm.

6
17
103
Coming into this week, our "bull market re-born" checklist was still 0/5.
Haven't seen anything yet this week that would change that.

5
30
100
Plenty of wailing and gnashing of teeth over weakness in tech land this week, meanwhile 75% of stocks in Financials sector hit new 52-week highs - the most in at least a decade.

4
14
101
It gets dismissed because it doesn't fit with the narrative, but new lows > new highs (13 weeks and counting) is not typically consistent with bull market behavior.

8
20
102

99% of industry groups are above their 10-week average.
Last three times this happened:
Nov 2020
Jun 2020
Mar 2019

8
21
104
Over at the NASDAQ:
-95% of the trading days in the past 3 months have seen more new lows than new highs.
-Nearly half (45%) of stocks in the composite have been cut in half.
-$NDX is 15% below its Nov peak.
Can't we stop pretending & just call it a bear market at this point.

6
18
99
New highs > new lows last week for first time since August and only 3rd time since Nov 2021.

4
26
100
Don't mean to ruffle feathers with everyone gawking at where stocks & indexes are relative to 200-day averages, but here is a contrarian view of breadth:
Over the past three years nearly all net gains in $SPX have come when fewer than 61% of stocks were > 200-d avg.

5
28
101
NAAIM exposure index increased to 57% this week. That's not fear. Stocks usually don't find a bottom until NAAIM is at or below 30%.

6
20
100
"Full Capitulation" back to Oct'08 levels means just 30% more downside for $SPX.

6
26
98