

Cameron Riddell
@RiddleMeCam
Followers
774
Following
776
Statuses
426
scientific computing, data science, Python enthusiast, instructor @dutc_training
Sacramento, CA
Joined December 2021
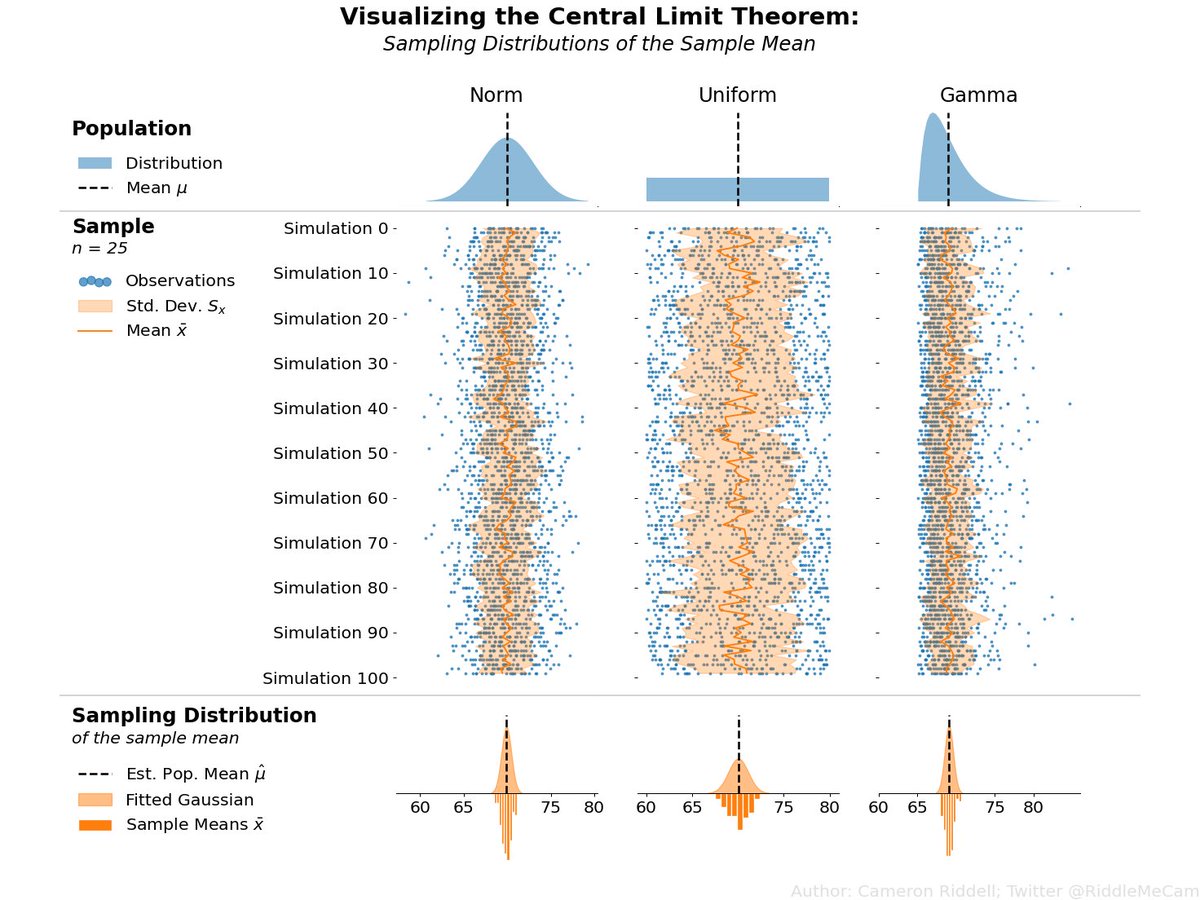
Been working on some visualizations in @matplotlib to highlight statistical concepts. This one intends to demonstrate (via simulation) the Central Limit Theorem: the sampling distribution of the mean is gaussian if given a large enough sample size regardless* of the population.
27
180
1K
@theAGU Of course everything you saw here was made entirely in @matplotlib - thanks for the SubFigures to help layout this "poster"!
0
0
1

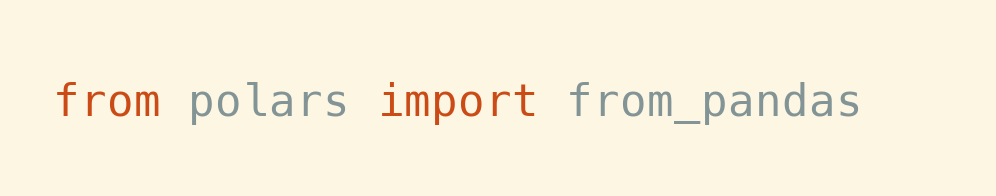
My favorite, funniest looking import I use since I keep replacing things I used to do in @pandas_dev with @DataPolars for data processing. That said, @pandas_dev is still an incredibly flexible tool with many diverse/useful functions making it a true data swiss-army knife.
0
0
2
RT @Sac_Py: @RiddleMeCam gave a great talk on Data Visualization in @matplotlib from the #CognitiveScience perspective.
0
1
0
@pandas_dev @DataPolars If you liked this thread, then take a more in-depth look at my blog post on this topic: where show these patterns in DuckDB and recreate them in both Polars and pandas.
0
0
4
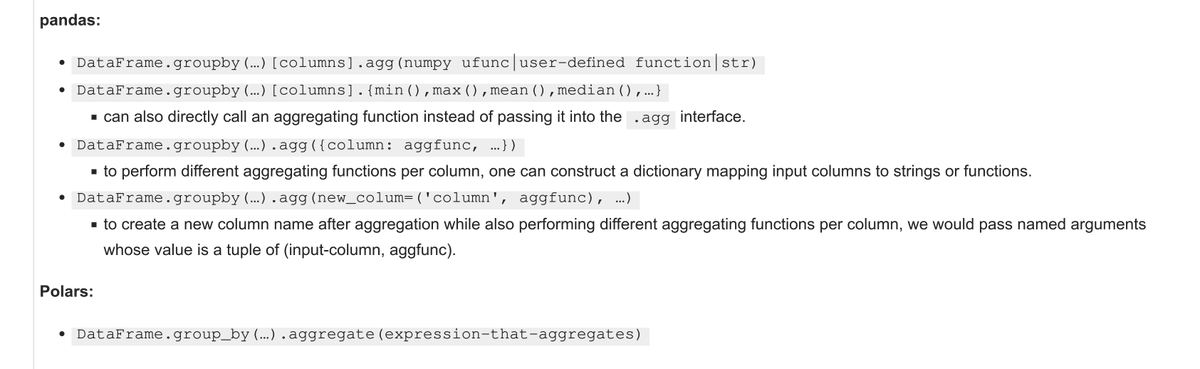
I love using both @pandas_dev and @DataPolars, but I will say that in terms of a consistent API, @DataPolars `group_by` context + expressions really takes the cake. See the rest of this comparison for group & window functions on my most recent blog post:
0
0
4
@R_Graph_Gallery Here's a straightforward Python example I modeled after the one you shared in R. The code exists as a gist here:

1
0
3
RT @matplotlib: Hey folks, can you do us a favor? If you're doing (or know about) NASA funded work using us, can you let us know? Thanks!
0
46
0
There are many ways one can provide intentionality in data visualization, the important thing is to begin thinking critically about what you want to visualize and how you can support that goal. Check out recent blog post for more on this topic
0
0
0