
Morten N. Støstad
@MortenStostad
Followers
4,072
Following
750
Media
189
Statuses
872
Post-doc at @TheChoiceLab @NHHEcon . Lecturer at @UCBerkeley Spring '24. Studying inequality's consequences. Once upon a time I was an astrophysicist.
Joined February 2021
Don't wanna be here?
Send us removal request.
Explore trending content on Musk Viewer
lisa
• 562384 Tweets
Colombia
• 193966 Tweets
#السعوديه_البحرين
• 174307 Tweets
England
• 164351 Tweets
سالم
• 113694 Tweets
#VSFashionShow
• 96170 Tweets
Tuchel
• 94411 Tweets
مانشيني
• 59067 Tweets
ADRIANA LIMA
• 48584 Tweets
Amari Cooper
• 43655 Tweets
Tyla
• 40077 Tweets
#GHLímite6
• 39620 Tweets
Córdoba
• 38715 Tweets
GIGI
• 38529 Tweets
المنتخب السعودي
• 32426 Tweets
James Rodríguez
• 31709 Tweets
Durán
• 30942 Tweets
Cher
• 27925 Tweets
Tapia
• 27398 Tweets
#فزعه_الشعب_السعودي
• 23499 Tweets
EU TE TRATO MAL
• 20997 Tweets
Gareca
• 16266 Tweets
Lucho
• 14996 Tweets
Dávila
• 13909 Tweets
Barranquilla
• 13376 Tweets
Vidal
• 11203 Tweets


Pinned Tweet

New publication: "Inequality as an Externality", w. F. Cowell in the Journal of Public Economics.
We argue that most major economic models assume that economic inequality has essentially no societal consequences.
Why? The idea is that economic inequality is an externality.

7
151
700
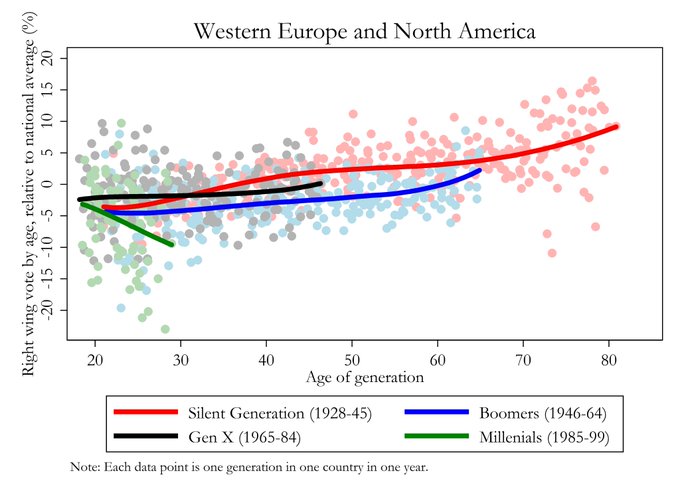
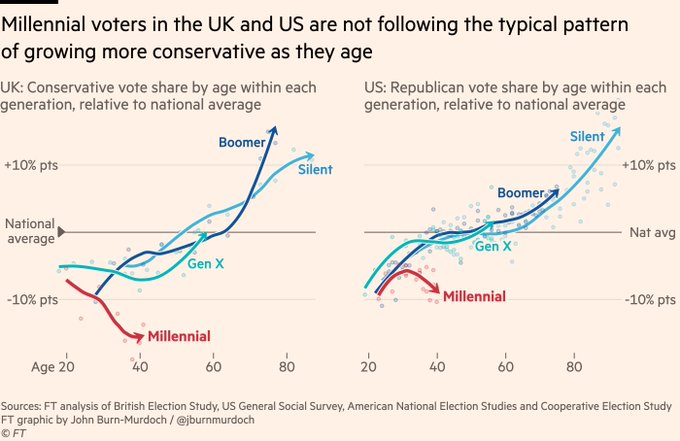
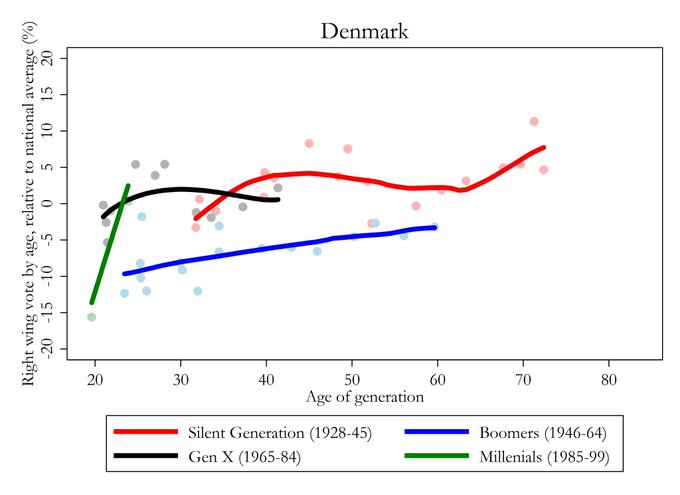
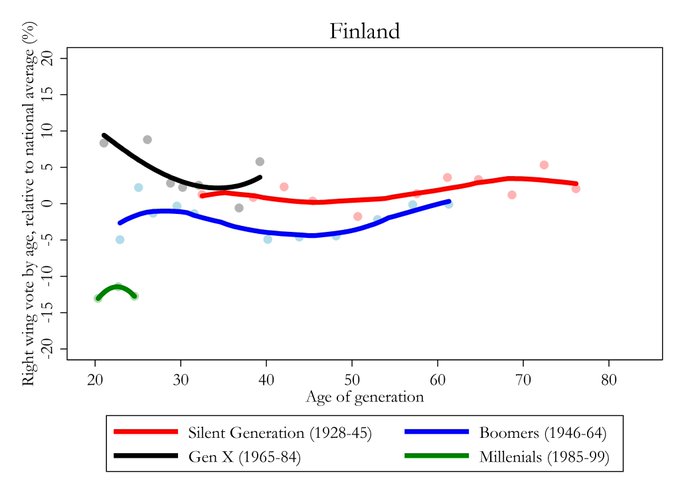
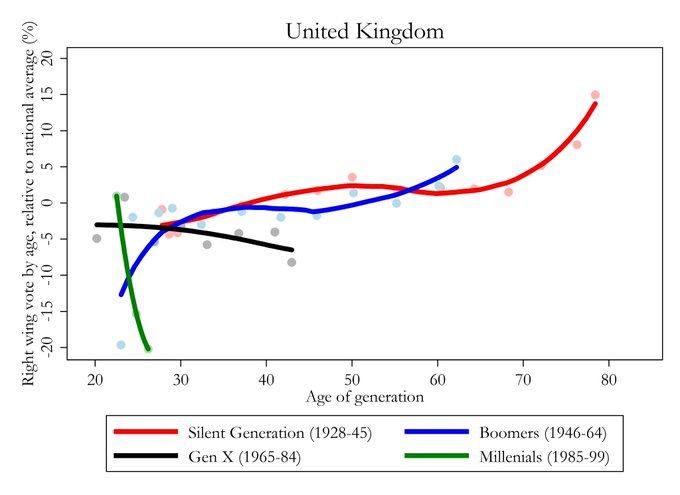
English-speaking Millennials are reversing an age-old trend, becoming more progressive instead of conservative as they age.
But in the non-Anglophone West, Millennials look more or less like everyone else.
99
694
5K
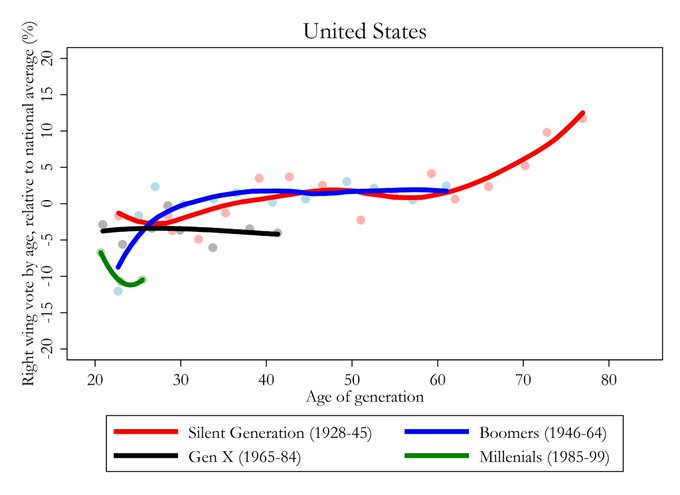
Do people become conservative with age? An update with 21 countries and 546,013 individuals.
The fascinating plot comes from
@jburnmurdoch
, based on the UK and US, and shows;
1. People become more right-wing with age.
2. Millennials are different.
But is this true everywhere?
82
738
3K
I sometimes get asked how to design surveys. This new working paper by
@S_Stantcheva
is the best introduction anyone could hope for:
It's extensive, clear, and on the research frontier. If you're looking to run surveys, read this.
17
417
2K
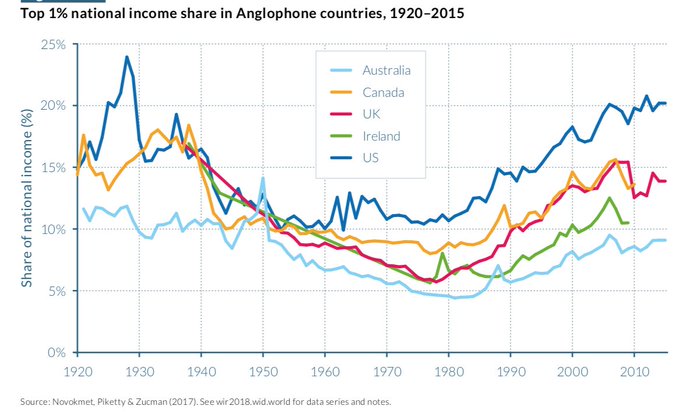
This semester I've been teaching "Economic Inequality and Growth" at
@UCBerkeley
. This is a thread with some of my favorite graphs.
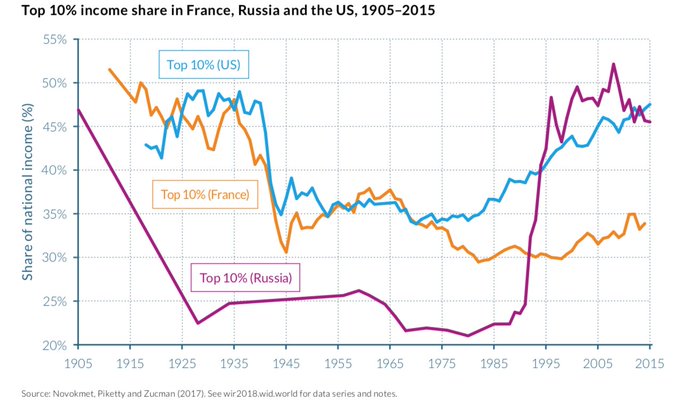
First, the headline everyone's-seen-it graph: falling then rising income inequality in Anglophone countries.
33
393
1K
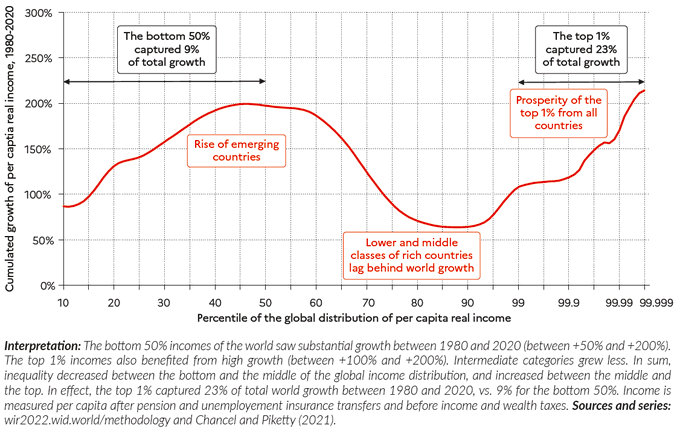
In honor of my last day of teaching "Economic Inequality and Growth" at
@UCBerkeley
, some more graphs.
I'll start with the famous elephant curve popularized by
@BrankoMilan
. Between 1980-2020, most global growth was captured by either the global bottom 50% or the top 1%.
13
173
678
A short primer on capital taxation, the most progressive type of taxation we have:
9
111
656
Ever wondered where inequality decreased the most in the last 10-15 years?
The other day a friend asked me, and I realized I didn't know. So I crunched the numbers.
Here are the 5 countries where income inequality decreased the most between 2007 and 2021:
3
165
535
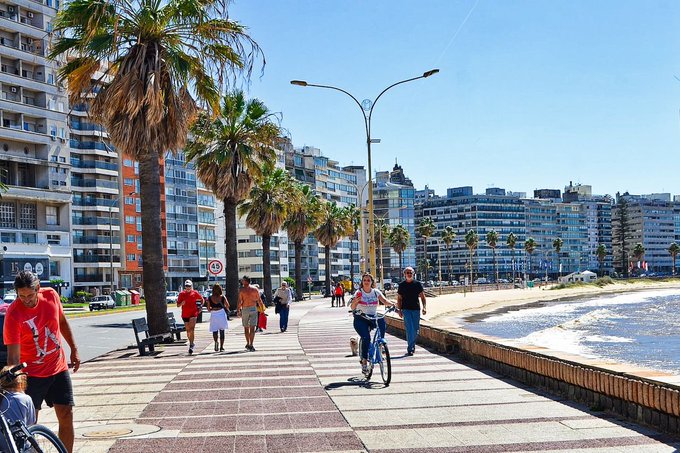
#1
. 🇺🇾 Uruguay. Following progressive tax reform in 2007 and subsequent social reforms, the top 10% share dropped precipitously from 46% to 38%.
The Broad Front govt coalition (2005-2020) also increased min. wages, introduced universal health care, and expanded social programs.
4
64
489
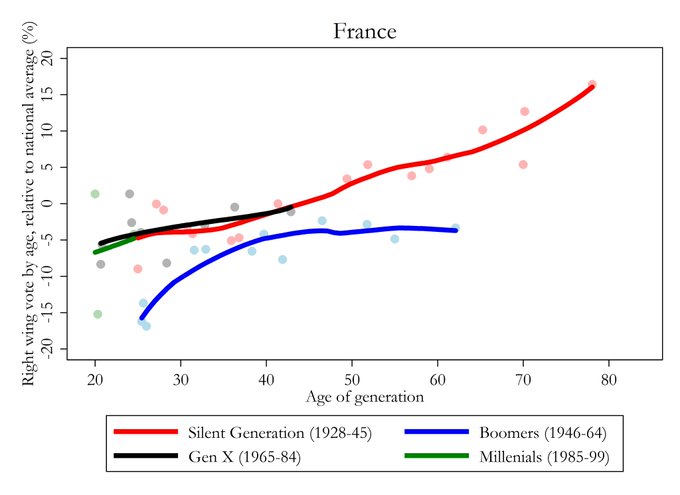
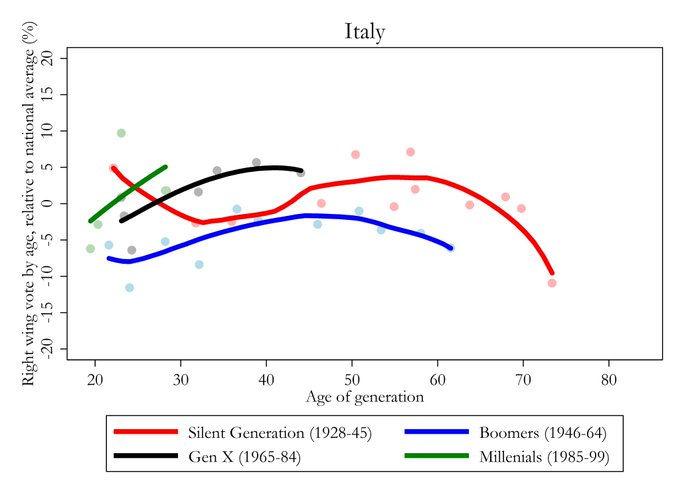
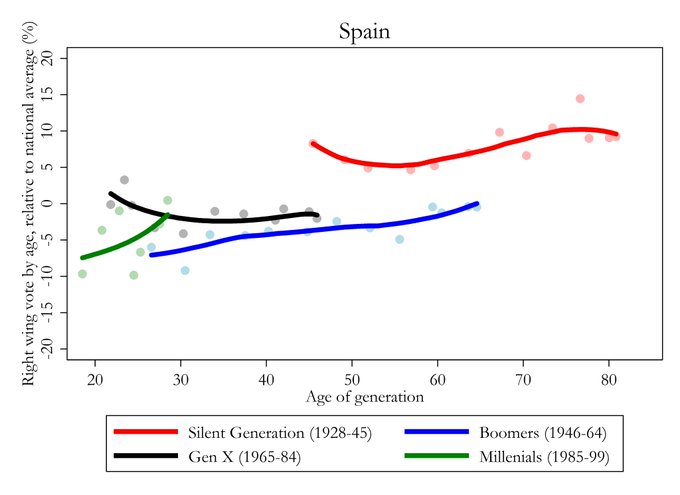
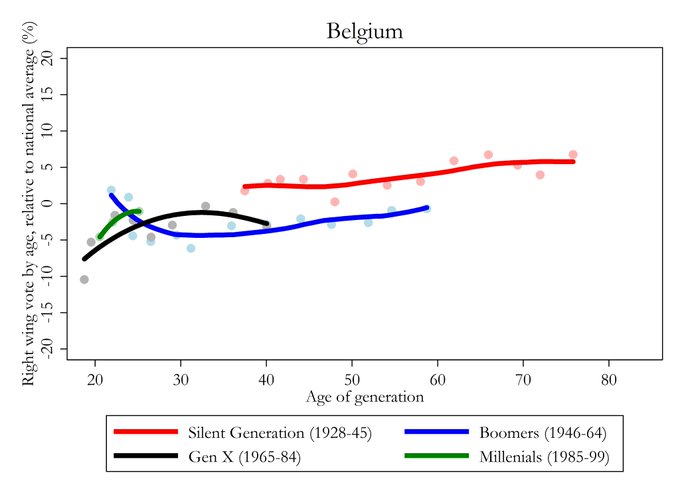
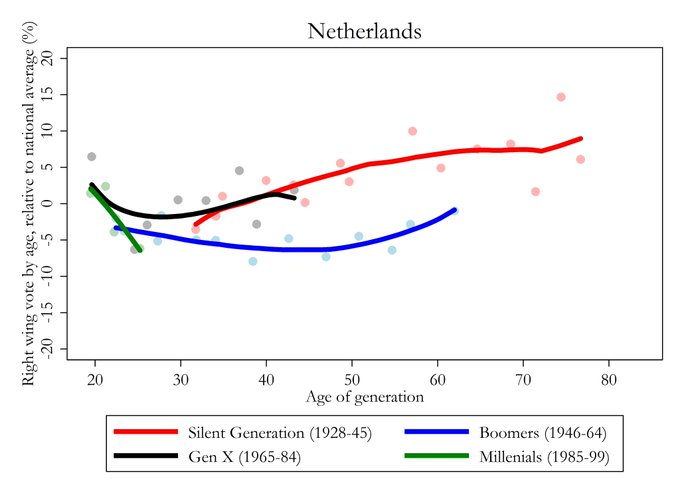
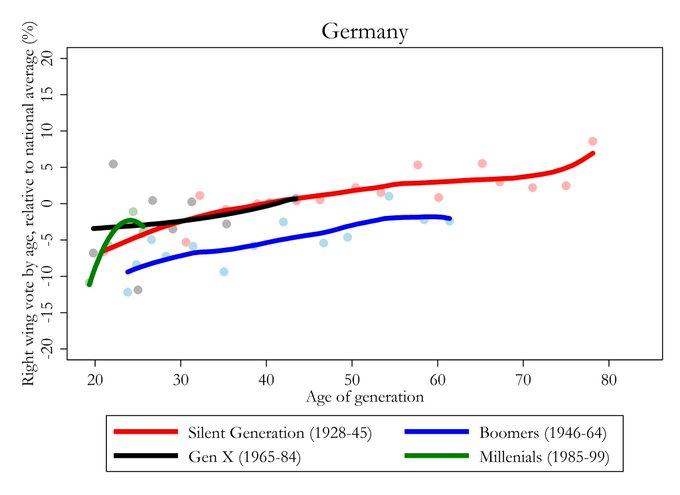
But it is not true everywhere. Mainland Europe is quite different, for example.
In Germany, France, Italy and Spain, millennials are right on track, following in the footsteps of previous generations.

15
108
373
Anyway, to return to our hypotheses,
1. Do people become more right-wing with age?
Yes! Almost everywhere, with rare exceptions.
2. Are millennials different?
In the Anglosphere, absolutely. But mainland Europe is different -- and each country has its own story.
16
52
355
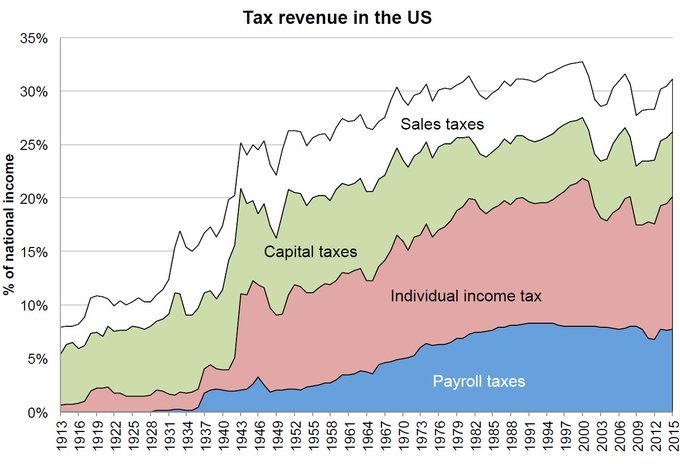
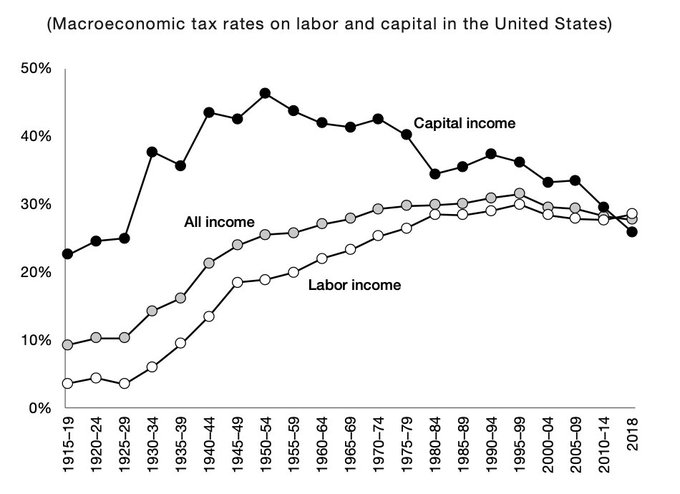
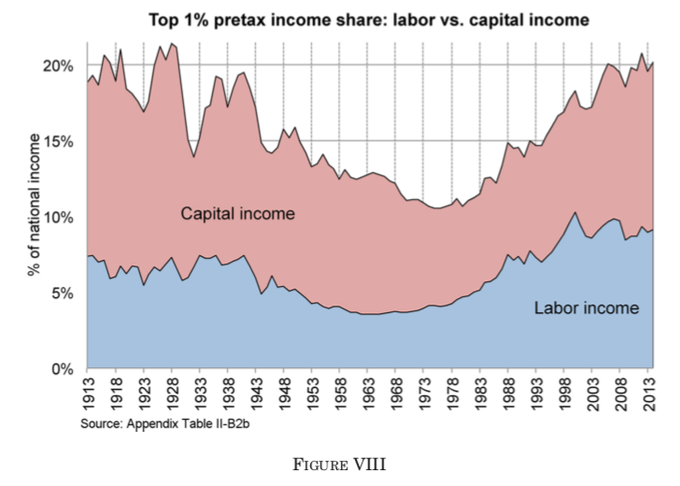
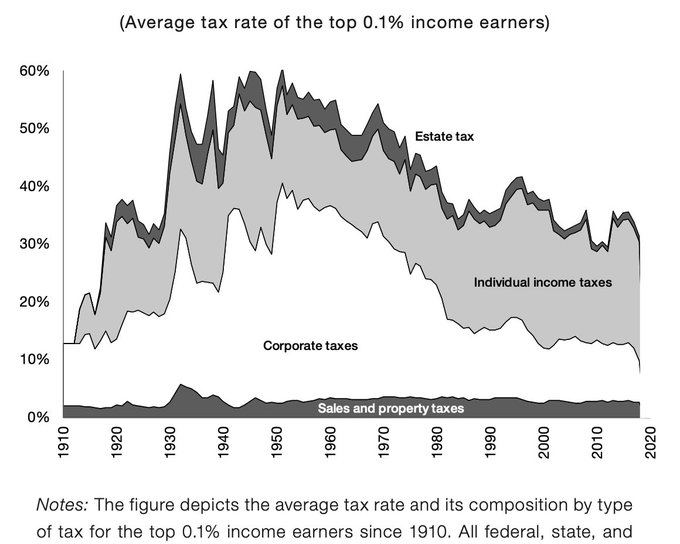
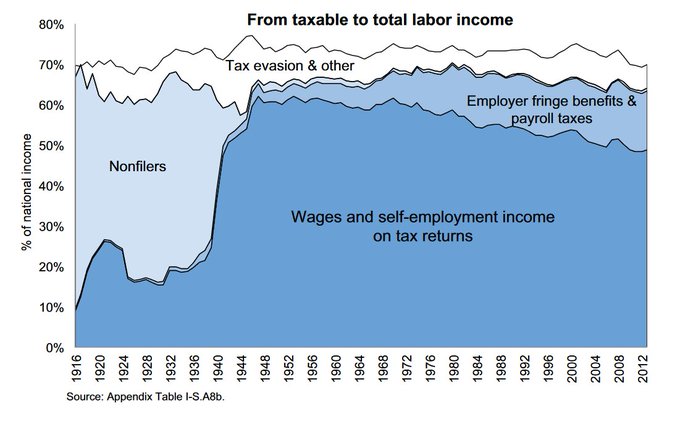
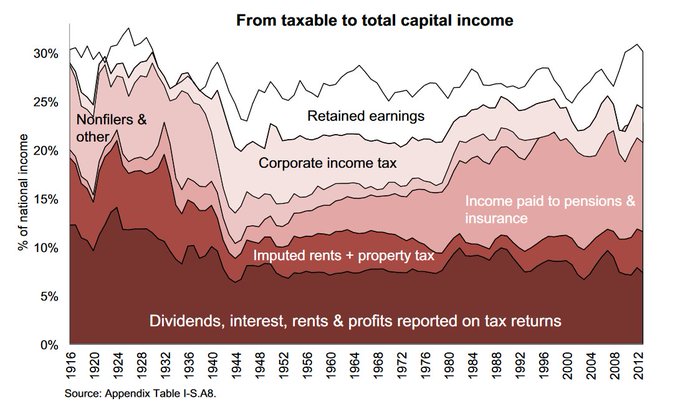
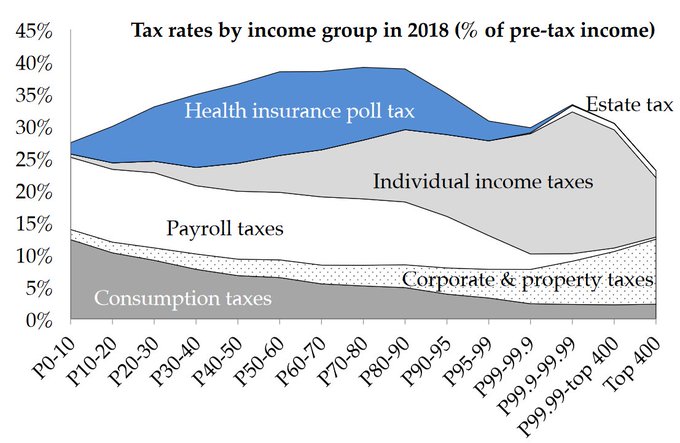
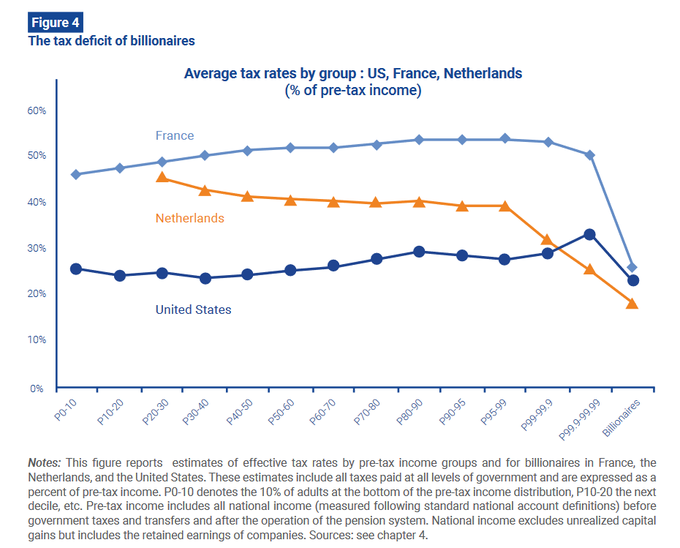
Overall, taxation in the U.S. has shifted from those who own (capital) to those who work (labor).
6
104
349
Headline: We really do tend to grow more conservative as we age.
Across the West, the shift accounts for ~10 percentage points over the lifetime.
But there are differences across the generations. Millennials have trended in the opposite direction (!) so far.
13
67
343
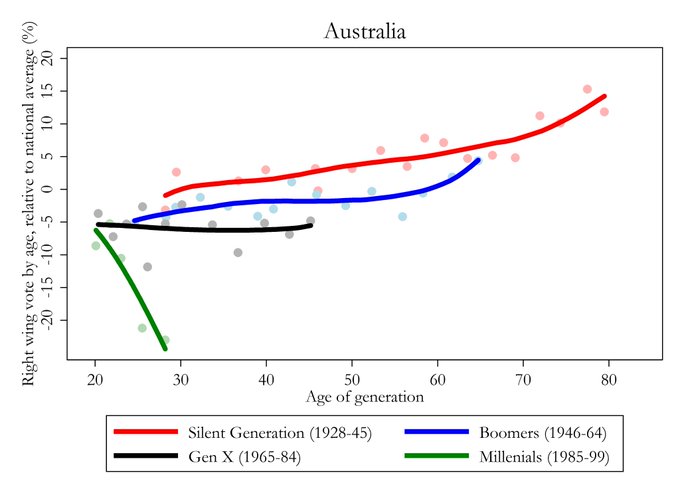
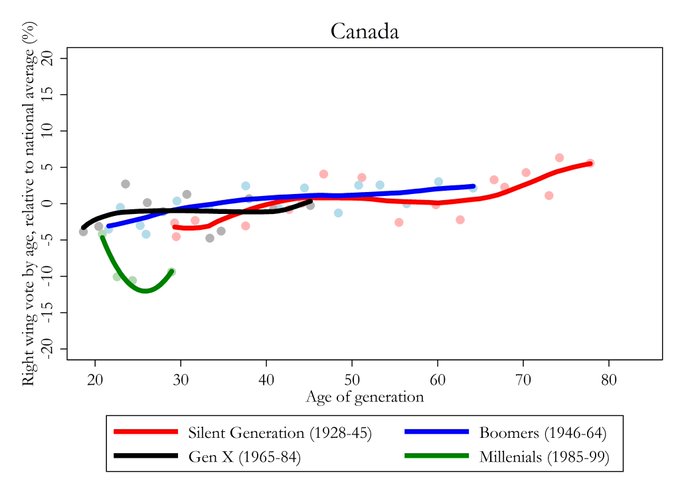
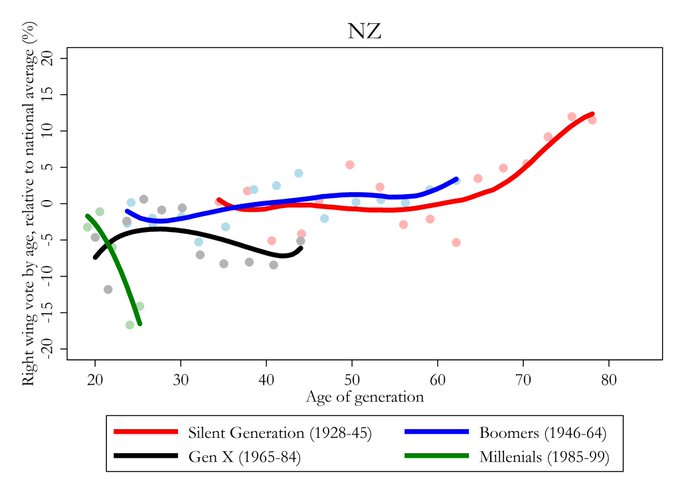
There are other countries where this millennial-specific trend is clear, especially in the Anglosphere.
Here's Australia, Canada, and New Zealand.
11
79
297
And a progressive U.S. tax system has turned regressive.
7
76
285
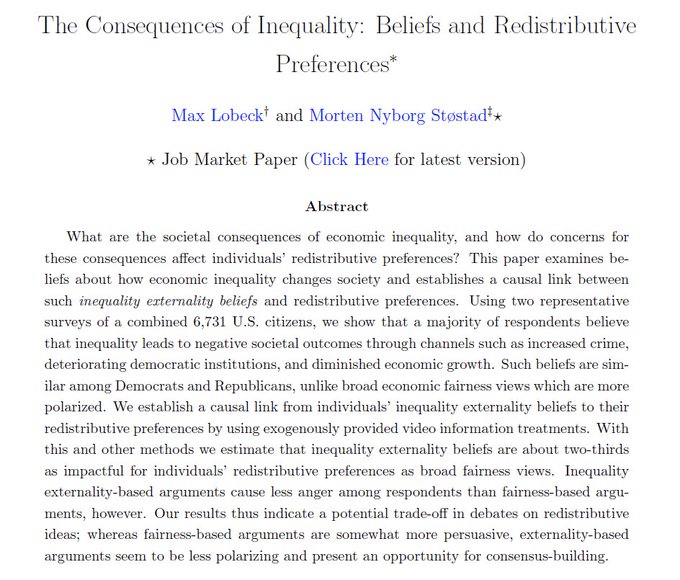
Very happy to share my JMP, w.
@LobeckMax
:
“The Consequences of Inequality: Beliefs and Redistributive Preferences”
We explore (i) how people think economic inequality changes society, and (ii) how such beliefs affect preferences for redistribution. 1/n
4
60
247
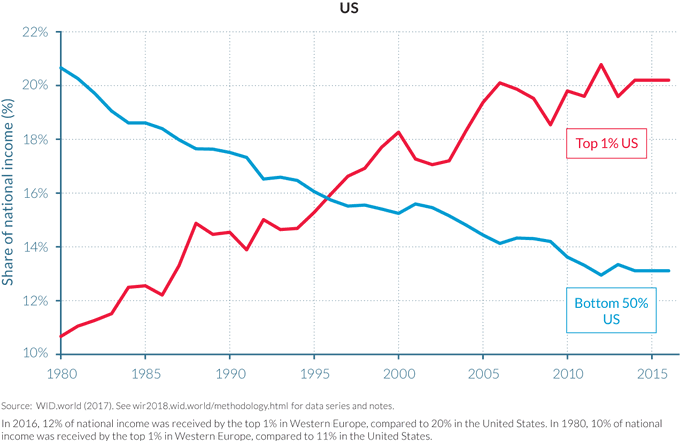
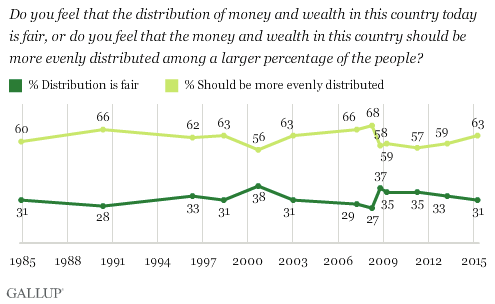
An interesting combination of facts:
1. U.S. income inequality has risen significantly since 1980, but
2. The share of U.S. citizens who say the income distribution is fair did not change between 1985 and 2015.
11
54
244
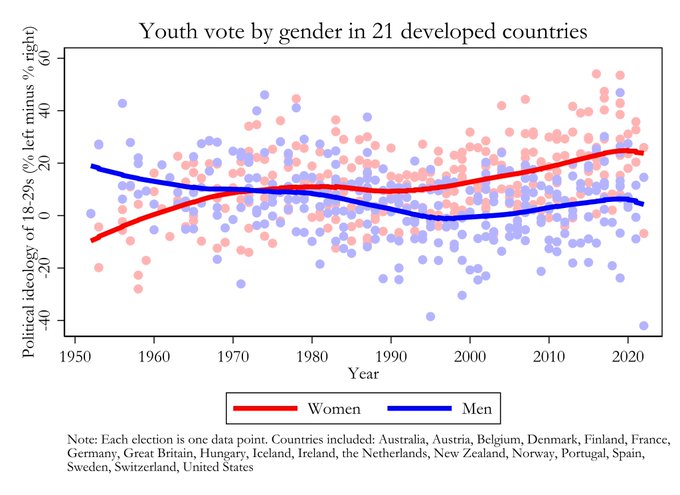
Is there an increasing gender gap in young people's ideology across the developed world?
Yes, at least in the long term. But there is significant country-level variation.
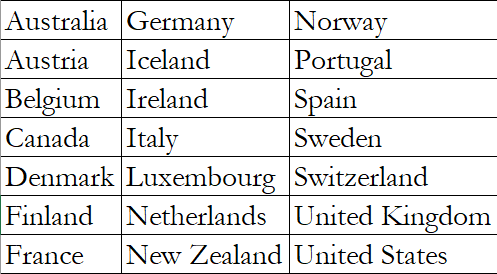
The graph: 126,072 individuals in 21 developed countries over 70 years. Below, specific countries.
11
76
229
Following up on this thread on "Economic Inequality and Growth", the course slides are now available here:
The goal of the course was to introduce students to economics through a lens of inequality.

This semester I've been teaching "Economic Inequality and Growth" at
@UCBerkeley
. This is a thread with some of my favorite graphs.
First, the headline everyone's-seen-it graph: falling then rising income inequality in Anglophone countries.
33
393
1K
3
65
232
Hello Twitter! I'm presenting at the EEA conference tomorrow, and thought this was a good time to talk about the paper (co-auth with F Cowell, LSE). In short; we argue that decades of economic theory has implicitly assumed that economic inequality has no societal effects. 1/n
4
37
196
At the same time, it's clear that inequality is usually a policy choice.
There is no intrinsic trade-off with growth; 🇺🇾, 🇨🇱 and 🇸🇰 all experienced strong overall growth in the period.
2
32
195

This is based on my thread here:
Which is based on this work by
@jburnmurdoch
:

NEW: conservatives have a Millennials problem.
In both UK & US, it’s not just that Millennials aren’t voting conservative because they’re young.
Every previous generation grew more conservative with age, but Millennials are not playing ball.
My column:
1K
6K
26K
2
17
189
Had fun making this, thanks for the idea
@jburnmurdoch
.
If anyone wants a different country, let me know and I'll see what I can do.
33
11
174
Some immediate takeaways;
There are many ways to reduce inequality. Social policies, improved public funding, minimum wages, low-wage growth through market policies, and so on.
1
20
162
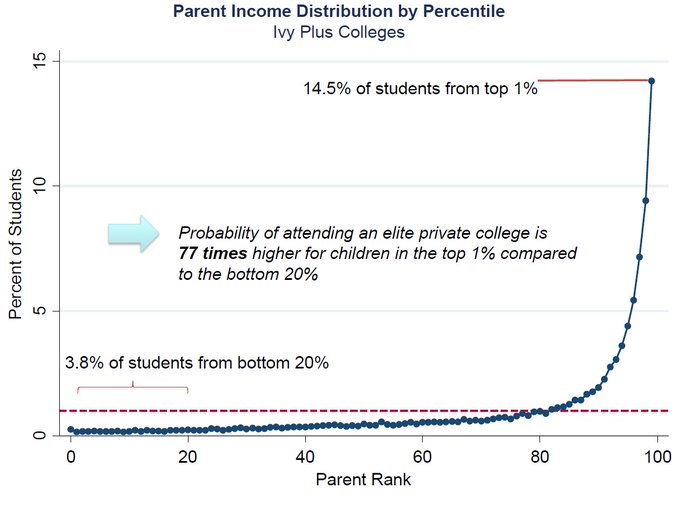
And finally, because it was a university course;
The chance of getting in to an "Ivy Plus" college is 77 times higher for children in the top 1% than those in the bottom 20%.
3
39
163
I saw
@jburnmurdoch
's post yday () and got curious about whether this was a US+UK story or a global one.
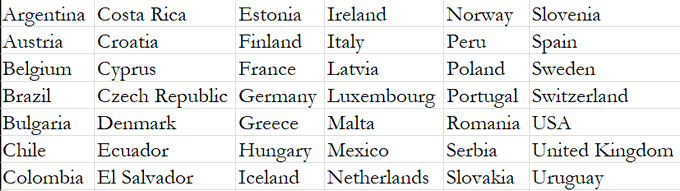
With the database (see the list of countries attached) and some good help from
@amorygethin
, here's the story:
NEW: conservatives have a Millennials problem.
In both UK & US, it’s not just that Millennials aren’t voting conservative because they’re young.
Every previous generation grew more conservative with age, but Millennials are not playing ball.
My column:
1K
6K
26K
2
31
159
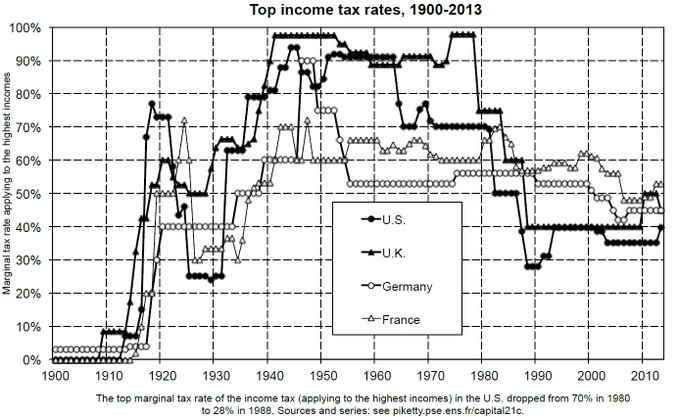
Why? Well, taxation plays a huge role. Top marginal income tax rates have fallen drastically in many countries.
3
32
161
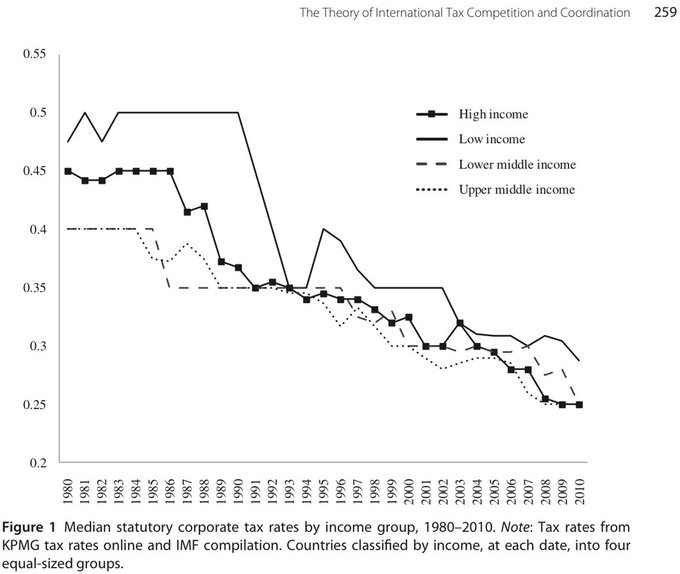
The income tax is only a small part of that story. Corporate tax rates have plummeted across the world.
2
25
153
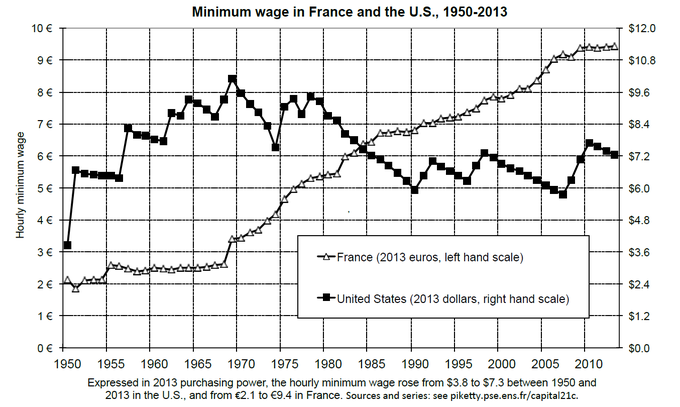
It's not all taxation, though. Market wages are crucial as well. Here is the minimum wage in France and the U.S. from 1950-2015.
Income inequality barely changed in France during this time.
3
24
151
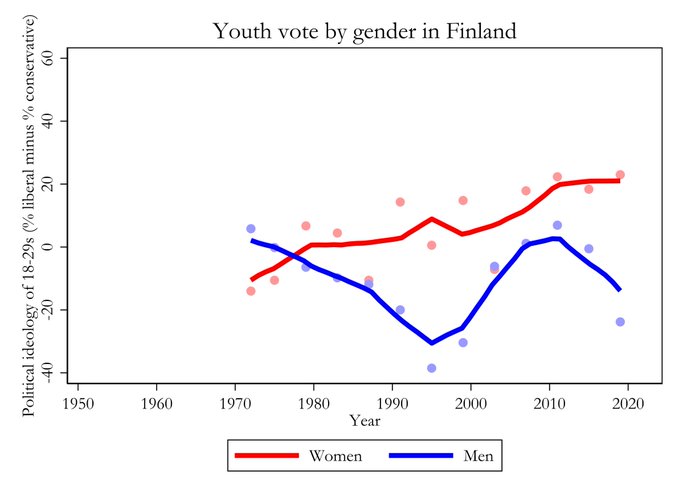
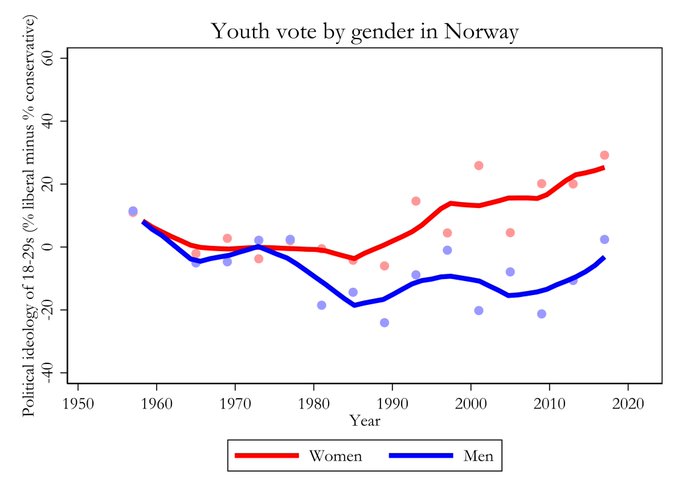
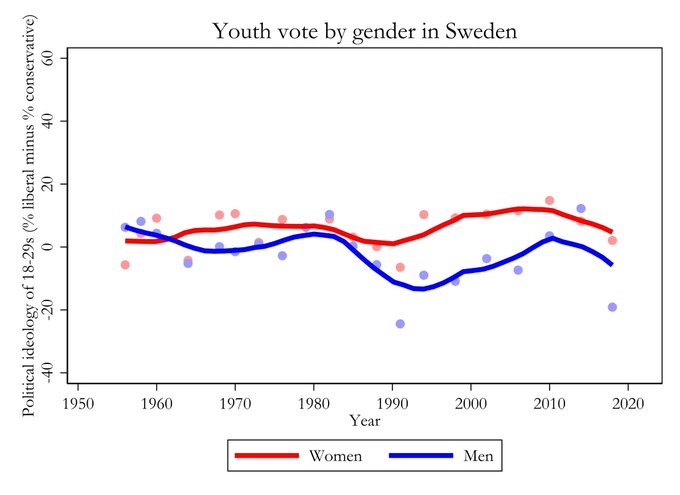
Norway and Sweden are relatively stable overall, with millennials trending softly left. Denmark is the opposite and closer to the other European countries, and Finland has a strong progressive millennial bend (probably due to
@MarinSanna
!)
3
25
145
#5
. 🇸🇰 Slovakia. After entering the Eurozone in '09, Slovakia decreased its top 10% share from 27% to 23%. This is the 2nd-lowest in the sample (after 🇳🇴).
The min. wage has risen fast (26%→41% of avg. wage) at the same time as unemployment has fallen (11%→6%). Impressive.
1
17
144
Speaking of the minimum wage, in Brazil the minimum wage was doubled over 16 years. The resulting compression of the wage distribution is stunning.
@NiklasEngbom
& Moser 2022
2
18
147
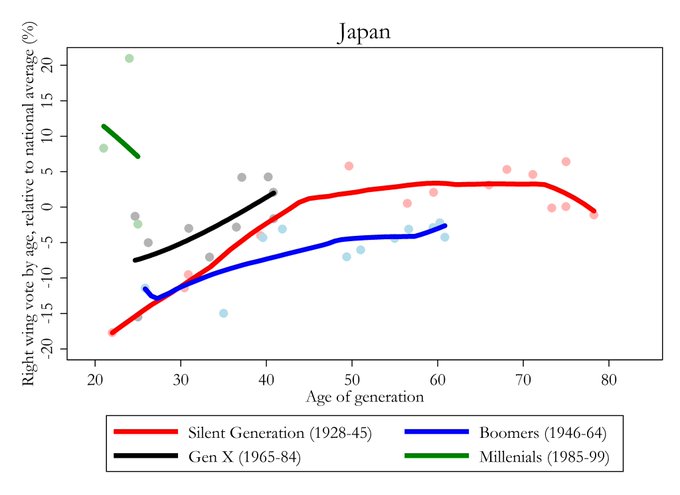
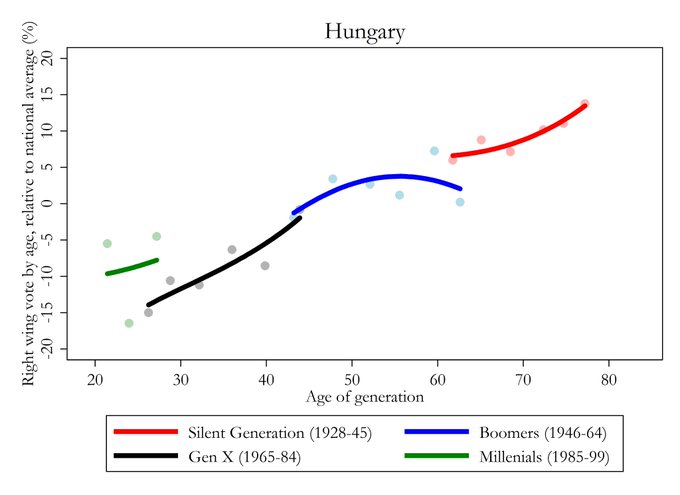
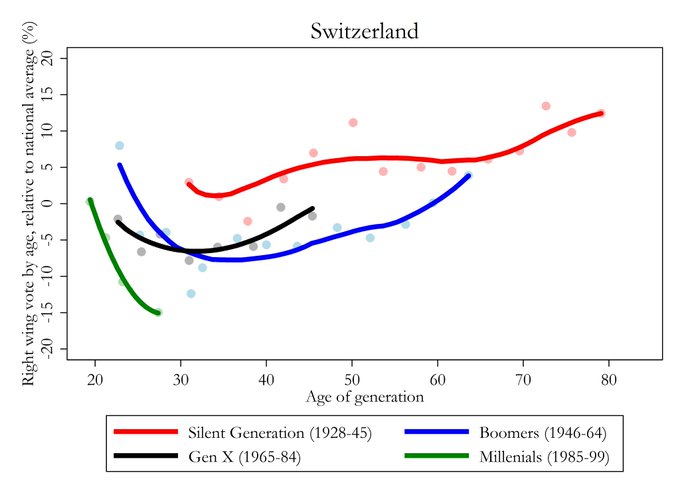
Japan, Hungary, and Switzerland all have interesting patterns.
(You might say that Japan is not in the West -- true. It is one of 31 more countries and ~600,000 more respondents not included in the main graphs, as left/right is often unclear outside of the West.)
5
21
137
This mirrors what
@jburnmurdoch
finds in the UK and US, which we replicate. (Note: Only election polls until 2020, so fewer data points.)
2
16
130
Great to see this out in the open! I'm very excited to be joining the amazing
@TheChoiceLab
at
@NHHEcon
for a two-year postdoc starting this September.

We are pleased to announce that
@MortenStostad
has accepted the job offer as Postdoctoral Fellow in Behavioural Economics
@NHHEcon
and
@TheChoiceLab
. Morten is a PhD-candidate from the Paris School of Economics.
@PSEinfo
0
2
34
25
2
129
Belgium and the Netherlands are also similar to these, perhaps with some downward trend for millennials in the latter:
(PS: I'm noting the millennials specifically, but every generation is interesting -- lots of stories to take from each graph.)
3
17
121
There is much more to be done, but the study of inequality is growing up.
Credit to
@gabriel_zucman
for putting most of this together (and doing much of the original work in the first place!).
I'll probably post the lecture slides sometime in the future.
12
10
126
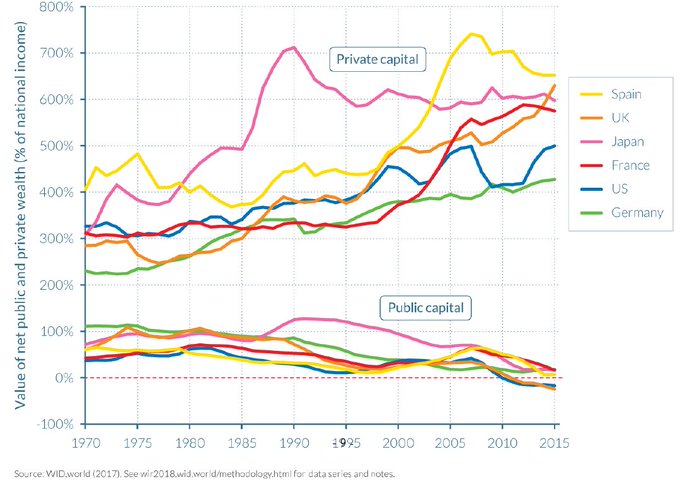
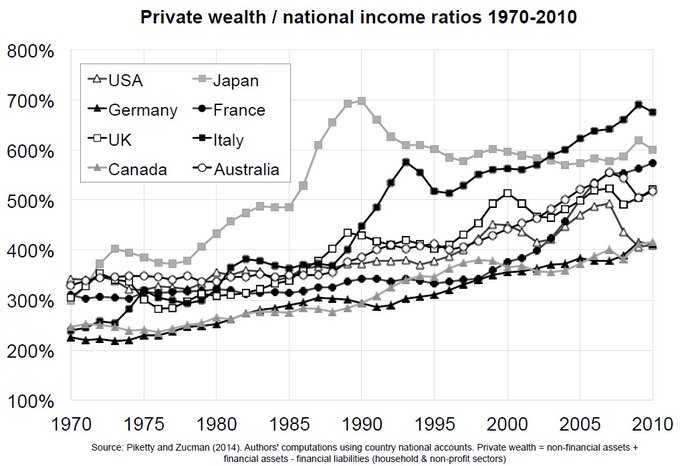
This is all private wealth, though. Governments are dead broke.
9
18
123
Read some aggressive criticisms by
@PhilWMagness
on
@gabriel_zucman
's recent NYTimes article. Because I think bias is bad, let me give some nuance

🧵Thread on
@gabriel_zucman
's claim that billionaires pay a lower tax rate than the average American, as published in yesterday's
@nytimes
.
The short version: Zucman manipulates his data to fit a pro-tax political narrative. You can see this by comparing to his own earlier work.
28
303
1K
4
17
121
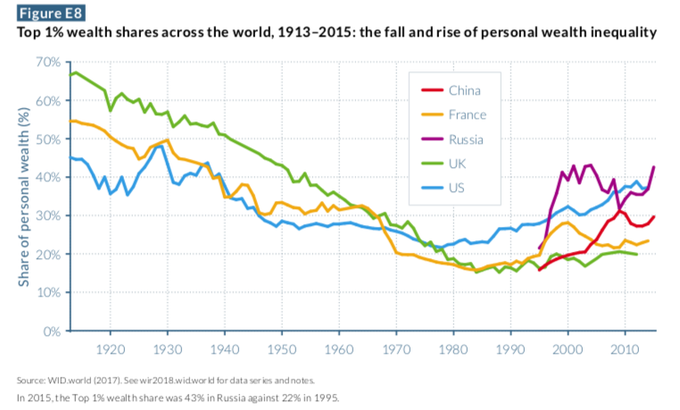
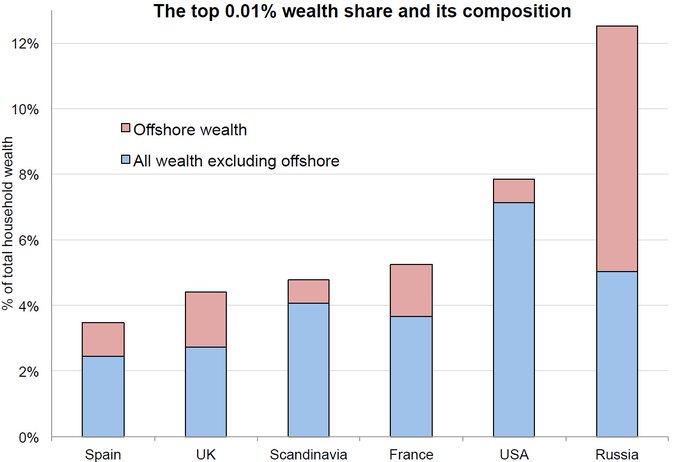
In other words, wealth inequality is more important than ever. Unfortunately it is also on the rise.
2
25
119
#3
. 🇸🇻 El Salvador. While struggling with low GDP growth in the period, the top 10% share decreased from 46% to 40% in El Salvador.
Increased trade diversification grew the middle-class, and tax revenue increased from 16%→19% of GDP, largely due to improved enforcement.

3
9
114
Is it possible to make an accessible thread about economic theory? Well, let's try.
Let me try to explain to you why:
* minimizing inequality is not the same as maximizing the income of the poorest,
* why economic modeling forgot this for a long time, and
* why it matters.
2
21
116
And across the world, wealth is becoming more and more important. Wealth-to-income ratios are rising everywhere.
2
18
115
I don't write about my research too often, so I try to make it count when I do.
My VoxEU article on the power of treating inequality as an externality:

2
20
112
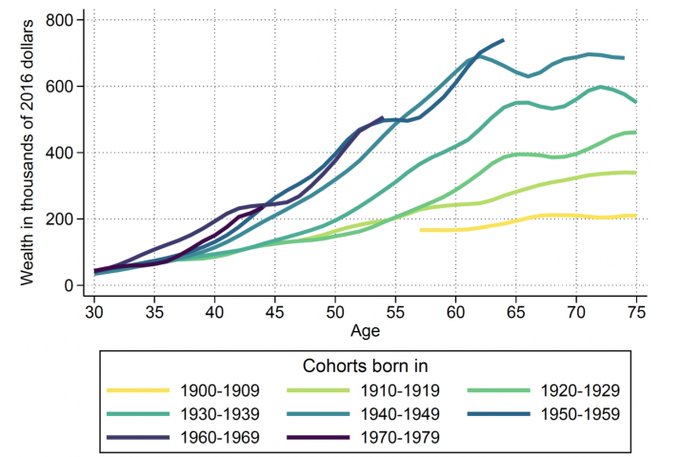
But inequality is also about wealth. Why we accumulate is a bit of a puzzle. When we retire, wealth stays constant -- we don't use it up.
@LuisBauluz
@TimothyAMeyer
2
14
108
#4
. 🇪🇨 Ecuador. The top 10% share plummeted from 46% in 2007 to 38% in 2016. High oil prices allowed progressive govt spending, and the min. wage increased quickly.
Since 2016, however, the tides have turned. Austerity and pro-market policies increased the top 10% share to 41%.

1
10
103
Capital taxes are progressive because capital is very unequally distributed.
For the bottom 90%, capital income is ~15% of total income.
For the top 1%, capital income is ~50% of total income (and much higher for the top 0.1%, 0.01%, etc).
2
9
105
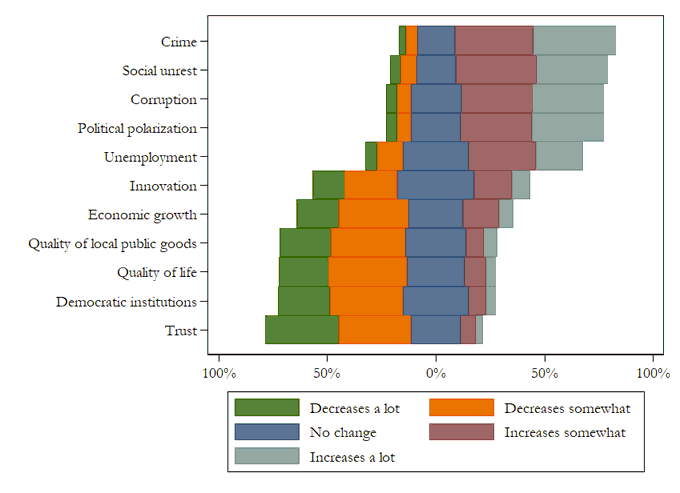
Perceived inequality has been in the news lately. Do you believe Saez-Zucman or Auten-Splinter? And how much does perceived inequality really matter?
In a short new WP I add to these debates, showing a simple fact:
Fairness beliefs causally affect perceived inequality levels.
2
16
100
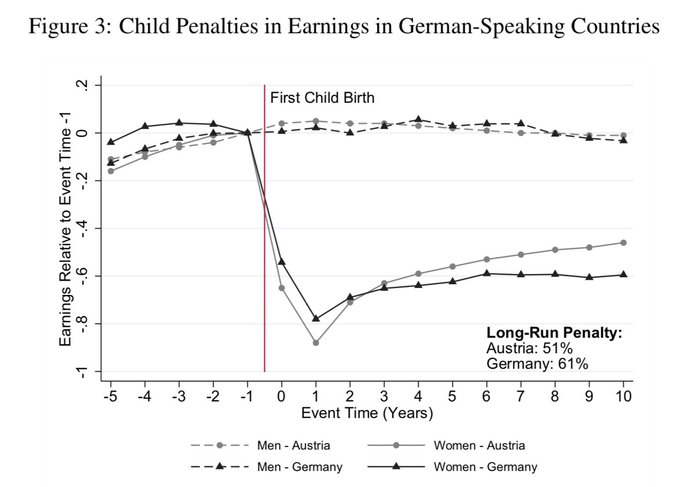
To bring us back from theory, economic inequality also strikes on other dimensions. The child penalty graphs of Kleven,
@landais_camille
et al are a beautiful and depressing example.
2
14
104
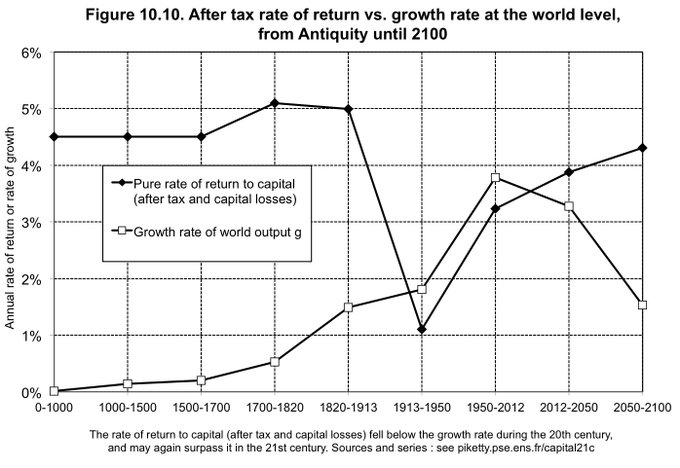
Why is this?
@PikettyWIL
's theory of r>g argues that high after-tax rates of return on capital makes it easy to accumulate faster than the economy grows.
In other words, low wealth inequality in the 1900s could be a historical aberration.
1
18
92
An addendum: I will also be a Lecturer at
@UCBerkeley
in Jan-April 2024, taking over "Global Inequality and Growth", Saez and
@gabriel_zucman
's inequality course.
Very excited about the opportunity and looking forward to visiting the Bay Area again.
Great to see this out in the open! I'm very excited to be joining the amazing
@TheChoiceLab
at
@NHHEcon
for a two-year postdoc starting this September.
25
2
129
8
1
92

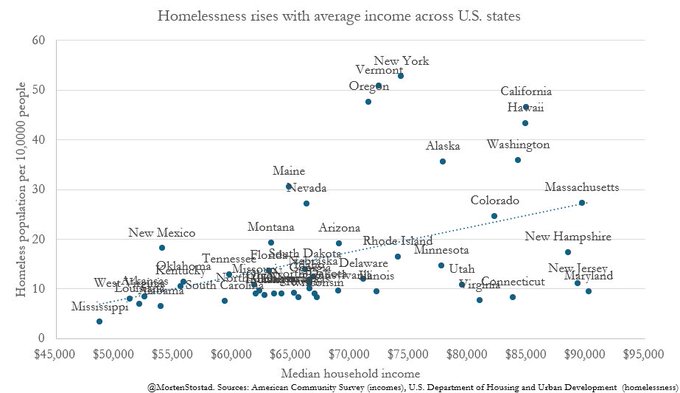
Homelessness is about inequality, not poverty.
Overall, homelessness rises with average income across states. There are homelessness epidemics in San Francisco and New York, not in Mississippi (which has the lowest rate in the US).
4
13
80
To finish; I found it interesting to learn the answer to my friend's question, and I hope you all did as well.
Any other analysis on these countries is welcome!
And watch this spot; I'll write about the 5 largest inequality increases soon.
3
3
77
I should also say that this is a simplified primer to a very complex issue.
There are many things I don't mention. The commodity boom that affected every LatAm country, Ecuador's massive inequality-fueled protests in 2022, El Salvador's deep crime problems, and so on.
1
5
76
Very happy that I will stay for a year in beautiful Marseille after having been awarded a one-year visiting scholarship by
@amseaixmars
.
This means that I'll finish my PhD and go on the market with this wonderful office view. Let me know if anyone is around for a coffee!

5
0
74
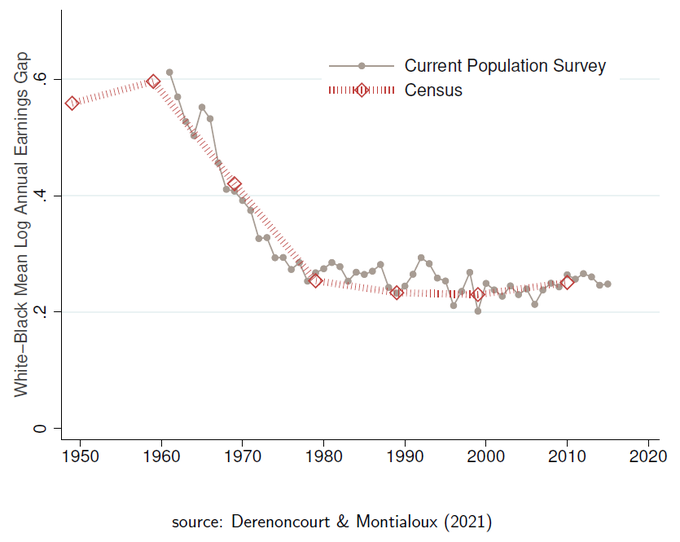
And progress is not certain. The U.S. racial earnings gap was reduced in the 1960-70s but has stayed roughly constant since.
@EDerenoncourt
@cmontialoux
1
10
73
...first, a few methodological details:
This is for the top 10% post-tax income share (health, education etc added). Data is noisy, so I'm using averages from '07-'11 and '17-'21. Only high-quality data from used (42 countries, most Americas+EU)
#1
is..
2
8
70
And who knows, a global 2% tax on billionaire wealth could be next:
There is real movement on global tax reform. A new era, perhaps.
Thanks for reading!
4
8
70
Capital taxation is any type of tax on capital (wealth) or the income that derives from capital (rent, dividends...).
Some notable examples are wealth taxes, corporate income taxes, estate taxes, and capital gains taxes.
This differs from taxes on labor (work) or consumption.
1
2
71
@arcivanov
@Nrg8000
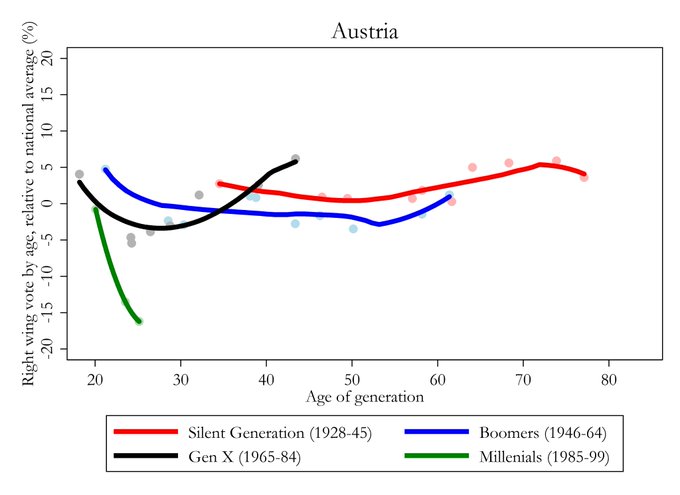
The x-axis is the average age of the survey respondents in the generation. Example: If we are looking at Millennials (1981-97) in a 2020 election, they are aged 23-39 and the x-axis is likely to be ~31.
Last data is also from 2020, so makes sense that last Millennial data is ~35
1
1
65
China played a big part in the rise of the global bottom 50%.
While even the poorest in China are much richer today than in 1980, income inequality in China has risen fast. Potentially faster than in the United States.
1
12
68
They're also important, however. The fall of capital taxation played a large part in the rise of income and wealth inequality in the US.

1
4
67
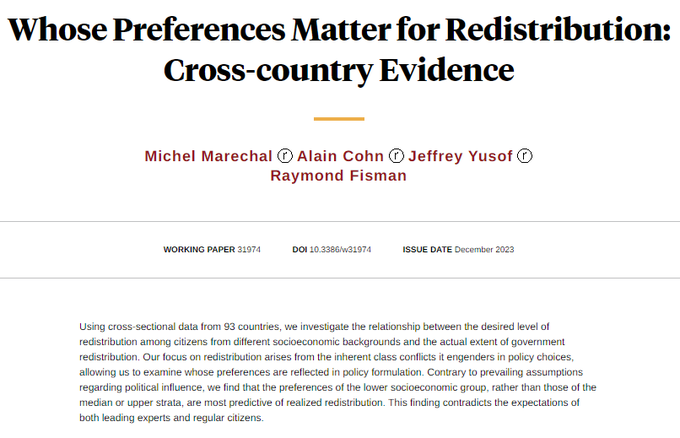
A new NBER WP finds that redistributive preferences are more correlated to low-income than high-income citizens' preferences globally.
What a surprising result. Goes against previous research and most models -- but the researchers involved are great.
What could be going on?

Contrary to median voter and elite capture models' predictions, low-income individuals' redistributive preferences are most predictive of actual redistribution across 93 countries, from Michel Marechal,
@alain_cohn
, Jeffrey Yusof, and
@rfisman
6
82
270
2
9
65
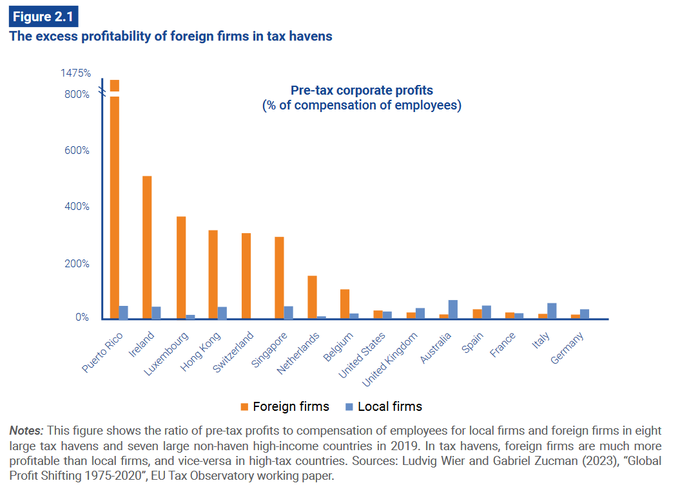
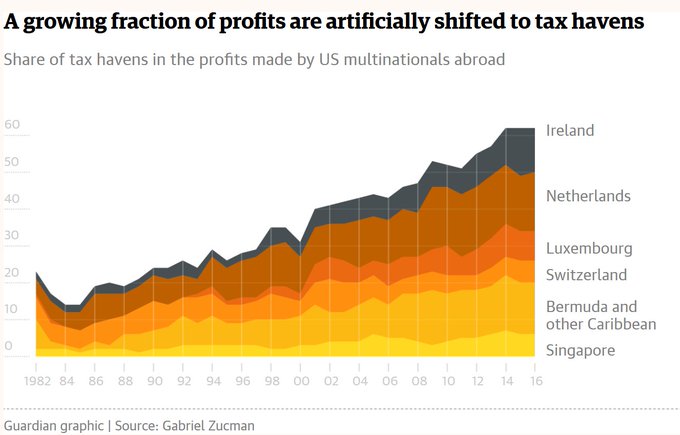
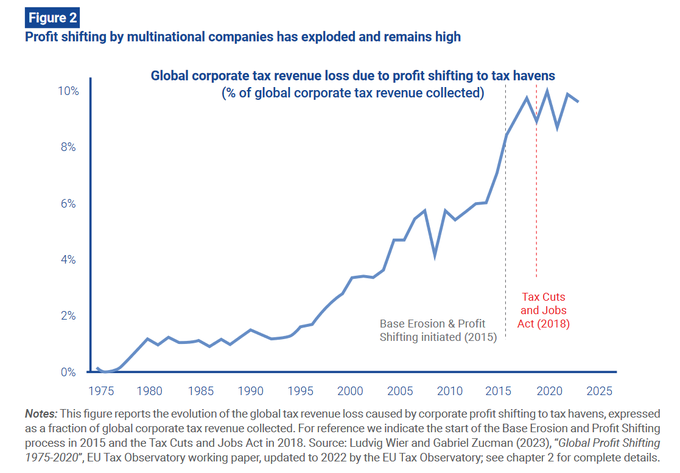
Observing profit shifting is easy. An example: Foreign firms are overly profitable in tax havens.
In Ireland, where corporate tax rates are 12.5%, each foreign firm worker makes 500% of their wages in profits. For workers at local firms the ratio is ~50%.
3
14
64
The other day I wrote about how the income inequality increase in Denmark between 2007-2021 is one of the largest in the world.
As a related point, it's interesting to see the evolution of the top 10% income share in Denmark, Sweden and Norway.
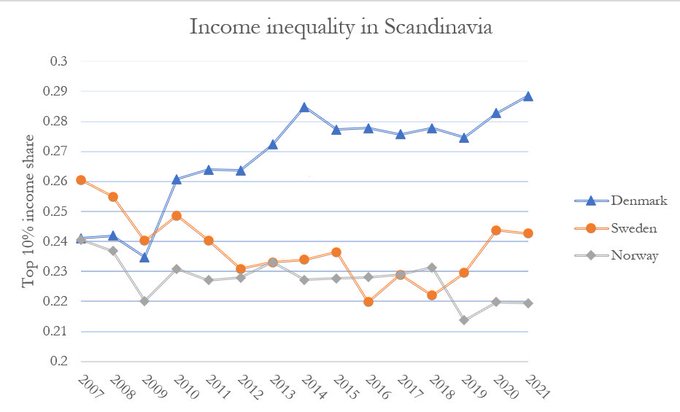
#2
.🇩🇰 Denmark. In 2007 the top 10% share was 24%, similar to the rest of Scandinavia (🇳🇴=22%, 🇸🇪=23%). In 2021 it was 29%, above the EU average of 28%.
Denmark cut top income taxes in '09, reduced transfers in various ways, and introduced a tax break for top-paid foreigners.
1
9
18
3
12
61
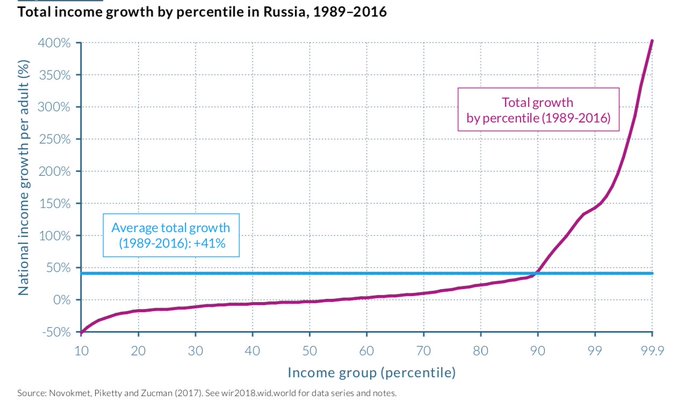
The rise of inequality in post-transition Russia is even more striking.
And in contrast to China, GDP growth has not made up the difference. The bottom 50% in Russia has had negative real income growth from 1989-2016.
1
19
62
And:
* The data is incomplete; f.ex., Asia is not covered at all
* Data is up until '21, so no recent events. Due to the averages, the trend is essentially 2009-19.
* Asserting causality for complex phenomena is often difficult!
* See for more data details

2
2
60
After all this talk about inequality measurement bias I think it's appropriate that I'm presenting this paper at the
@UCBerkeley
Public Finance seminar today.
In short, our biases strongly affect the way we view objective economic inequality.
Slides:


3
5
62
Hello Twitter. It's not ready for a full thread yet, but I'm presenting my JMP (w
@LobeckMax
) at the first session of the EEA Congress (Monday 2pm). So here are some preliminary statistics:
1. Between 85% and 97% of U.S. citizens think economic inequality affects society.
1
8
58
And _also_ the talk about a global wealth tax.
Today ministers from Germany, Brazil, Spain, and South Africa endorsed a global 2% wealth tax on the world's ~3000 billionaires:

2
7
58
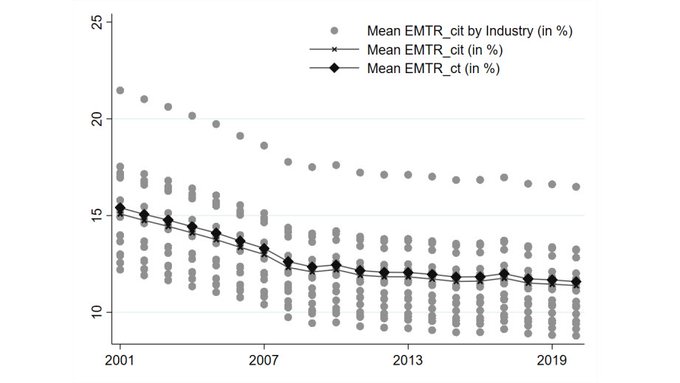
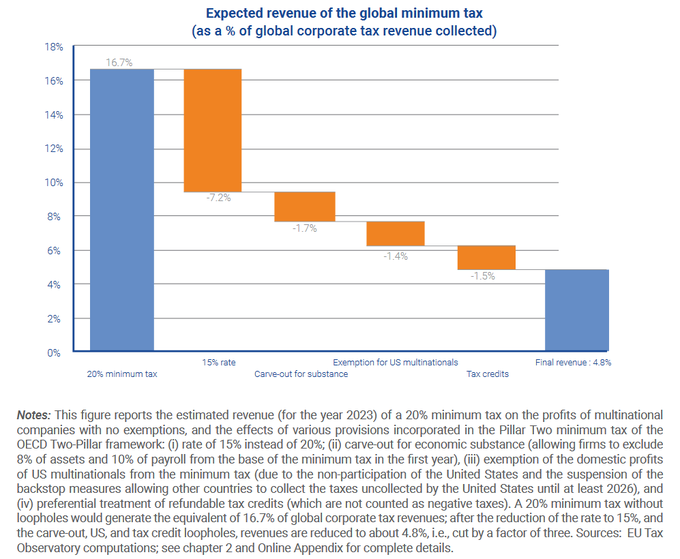
This is why it's encouraging to see 141 countries agree on a framework for a global corporate minimum tax of 15%:

1
1
51
Happy to see my paper with
@LobeckMax
as a WID working paper.
Main takeaways:
U.S. citizens strongly believe inequality changes society for the worse.
These beliefs are meaningful determinants of redistributive preferences in ways that differ from traditional fairness concerns.

📄 NEW WORKING PAPER by
@MortenStostad
&
@LobeckMax
How do we believe economic inequality changes society?
↪️A majority of 🇺🇸 citizens believe inequality has negative consequences on society, regardless of political affiliation or income
More findings⏩

1
10
28
0
9
50
Leaving UC Berkeley after a fantastic seven months' visit. Thankful to Emmanuel Saez for hosting me and to all the wonderful people I met for making it a visit I'll remember. Back to
@PSEinfo
!

1
0
49
Capital taxation is important, but complicated. Lacking state enforcement and global cooperation has created glaring loopholes.
An increasing fraction of US profits are artificially shifted to tax havens. In 2016, the share was ~60% (
@gabriel_zucman
)
1
10
49
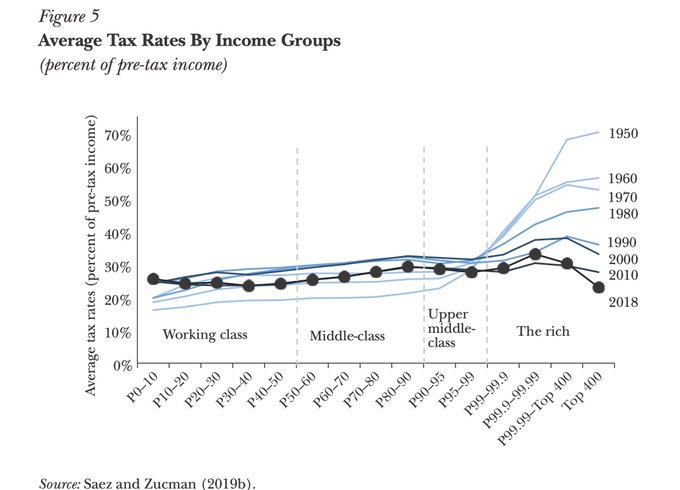
What's hidden in that graph is how tax composition has changed over time. Different taxes have different distributional impacts.
Here are the taxes paid by the top 0.1% in the U.S. from 1910-2020, assuming all corporate tax is paid by firm owners (Saez &
@gabriel_zucman
2019).
1
10
48
Capital taxes are complicated partly because capital income is complicated.
While labor income is mostly wages, there are many types of capital income.
1
1
48
Fascinating new database on tax rates across countries.
Here's how the top income tax rate correlates with the pre-tax (!) Gini coefficient, for example.
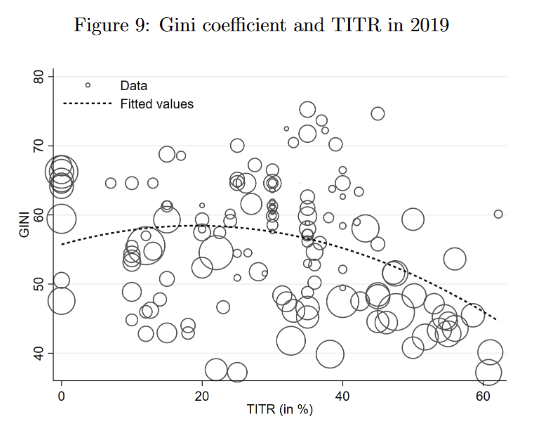

🚨Attention all international tax scholars! 💰🌍🧑🎓
We are super excited to share that our International Tax Institutions database became public!
The ITI provides in a single place the most relevant tax indicators for more than 200 jurisdictions over two decades 🧵
2
47
110
2
11
47
To think about how inequality can be reduced, let's go back a century or so.
This is the foundational graph of developed countries: the rise of tax revenue between 1900 to ~1980. The creation of the modern state.

1
8
47
Good news: Global poverty has reduced by ~30% more than we've thought since 1980.
This is because an increased public sector -- transfers, healthcare, education, etc -- has had no effect on traditional poverty statistics.
Fantastic WP from
@amorygethin
.
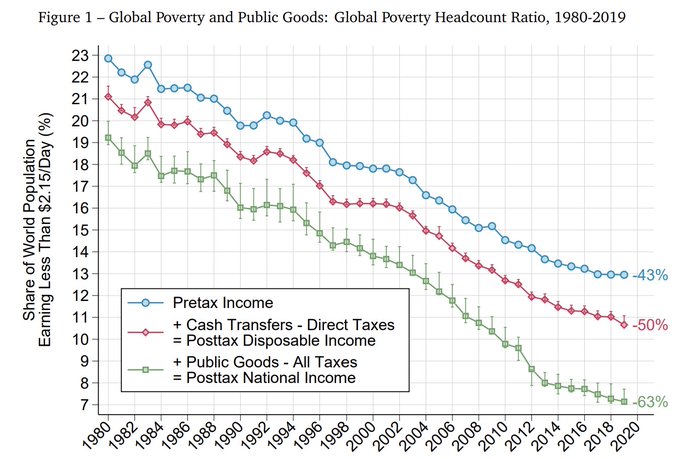

Global poverty is commonly measured by counting the number of people whose consumption falls below a given threshold.
This approach overlooks an enormous component of people’s economic well-being: public goods. 🧵
21
396
2K
0
12
46
My best guess is that we are entering a new era of global coordination on capital taxation. It is an extremely meaningful development unfolding before our eyes. Let's see where it takes us.
1
1
44
This might change, though. A 15% global minimum corporate income tax was recently agreed upon by 141
@OECD
countries.
It could be higher, and exemptions could be reduced, but it's a good start.
2
8
45
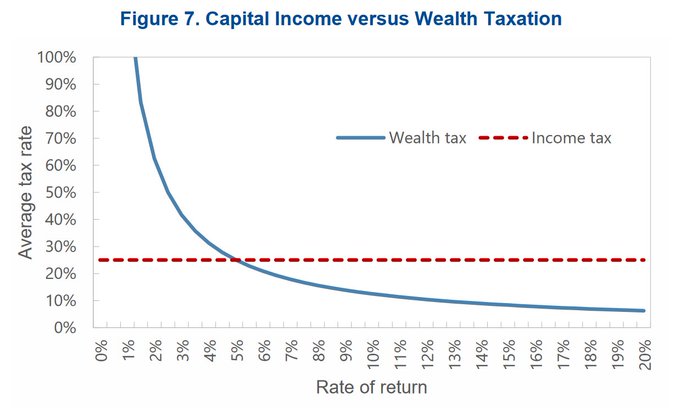
So from the point of view of economic efficiency we can say the following:
If high rates of return indicate economic activity, we should tax wealth.
If high rates of return indicate economic rents, we should tax capital income.
2
3
44
So -- how do we tax capital?
The first question is whether to tax capital (a stock) or capital income (a flow). The two are conceptually similar.
In theory, capital (wealth) taxes are capital income taxes that vary across the rate of return on capital.
3
2
43
So some taxes are more progressive than others.
Across the U.S. today, low-income individuals need to worry about consumption taxes, payroll taxes, and health insurance. Those at the top worry about income + corporate taxes.
(To be clear, this just who pays, not incidence.)
3
8
42
This is a very cool paper, but it assumes that wealth inequality has no meaningful effects on society. This is b/c wealth inequality is not in the utility function. It seems strange to assume this and then talk about how we should tax Jeff Bezos.


How should we tax capital gains due to rising asset prices? On realization? On accrual? Or should we perhaps tax wealth?
The existing public finance literature has a big hole making it unsuitable for thinking about these issues: it doesn't model asset prices!
🧵 on a new paper:

13
179
717
3
4
42
So, what if we only taxed capital income?
Then the top 0.1% can hide their incomes in holding companies, trusts, re-investments and so on -- and save without ever being taxed.
Unfortunate, because the rest of us have to pay taxes before we save.
This is the current situation.
2
2
42
One notable point from the last two graphs is that capital taxes are generally paid by the wealthy.
This is intuitive. Capital (wealth) is _always_ more unequally distributed than labor income. Always. Note the axes numbers.
@WIL_inequality
1
8
40
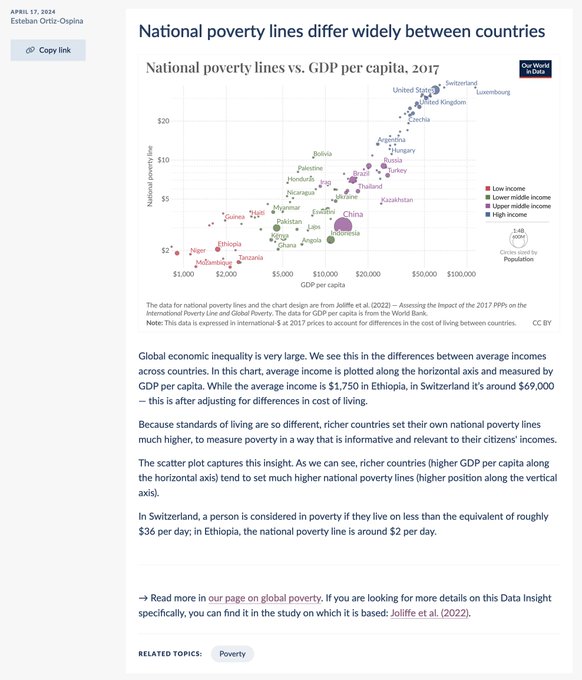
Something I'll never unlearn: Relative poverty is just another way to measure inequality.

$2 per day in Ethiopia — $36 per day in Switzerland.
In our latest 'Data Insight', my colleague
@EOrtizOspina
highlights the large differences between national poverty lines.
3
46
147
1
2
38
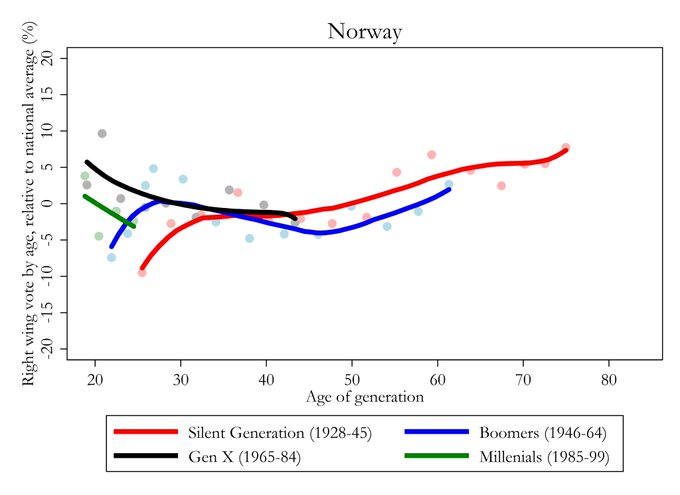
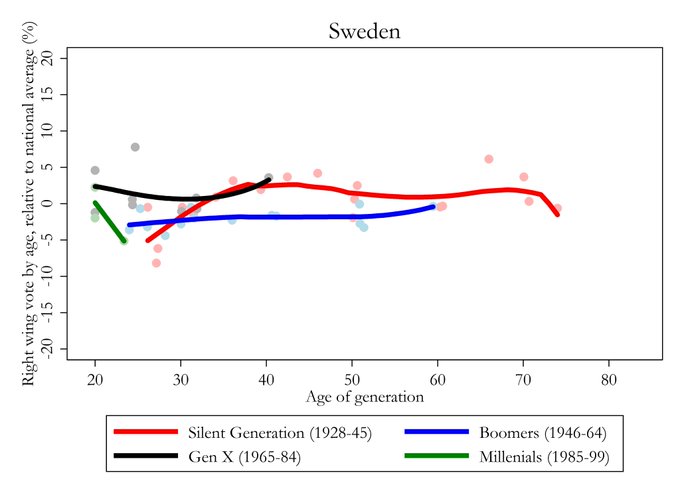
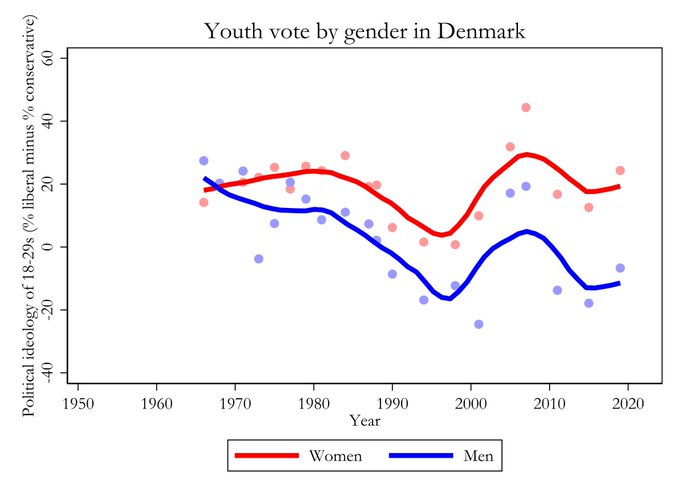
As a Norwegian, these are the most striking graphs to me. All the Scandinavian countries -- normally considered the most gender equal region in the world -- have the largest, most sustained gender gaps in youth voting.
In the Nordic countries, young women have been significantly more leftist than young men since the ~1990s.
In Finland, Denmark and Norway the gap is currently at 20-40p.p., or what I'd call very large.
2
2
12
3
5
37
Going to ask this question to my students tomorrow. What does Twitter think?
20
3
38
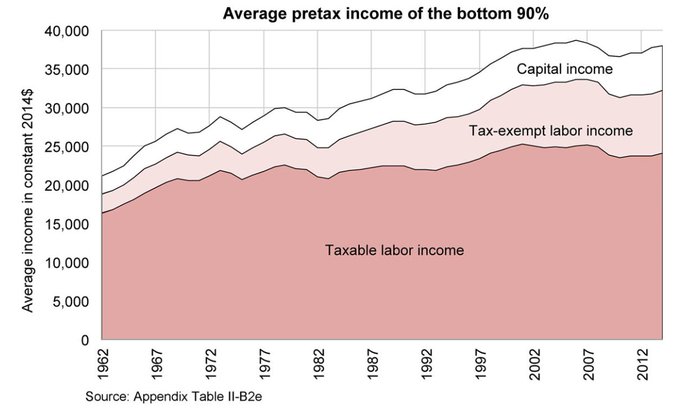
In other words, if you add all transfers to the "taxes paid" definition, all these graphs would look very progressive. Governments, overall, strongly reduce inequality. This is an important point that often gets lost.
5
4
38
It's unfortunately more complicated, though.
Suppose we only taxed wealth. Income shifting would be rampant. Business owners would declare all their income as dividends. Everyone who could would incorporate.
3
1
37
To see why, think about inactive wealth (zero rate of return). In this case a wealth tax would be expensive. A capital income tax would be free.
Vice versa for investments with high rates of return.
1
0
33
So suppose we tax both. The next problem is that capital is mobile. Profits can be shifted and the wealthy can move countries. In practice we _also_ need international cooperation.
1
2
36
Spain will reverse these VAT cuts soon, which reminds me of a beautiful graph from when Finland did the same thing. Overall, prices significantly increased.
Source is Benzarti et al 2020:


Spain cut VAT on essential groceries in 2023! We analysed vast amounts of price data to see whether supermarkets passed on the savings…
#bdeResearch
#Spain
#VAT
#Inflation
1/3

2
21
49
0
9
36
Where has income inequality increased the most lately?
A few weeks ago I wrote about where inequality decreased the most since 2007 (
#1
: 🇺🇾!).
Now we're back for the grim second round;
The five countries where income inequality increased the most from 2007-2021.
A thread:
1
16
36
Was happy to see this in AEJ:Applied today, by
@thomas_blncht
,
@amorygethin
and
@lucas_chancel
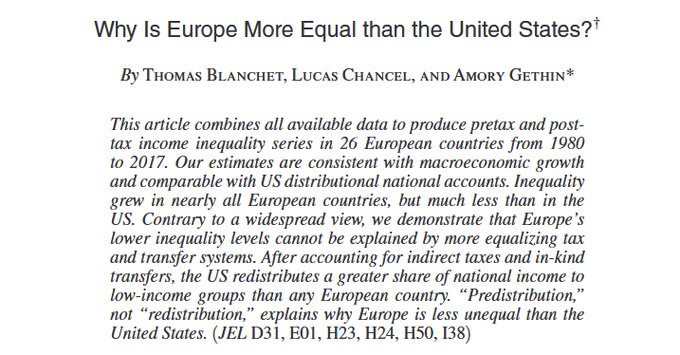
. Great paper pointing to the importance of "predistribution".
The argument: The pre-tax distribution explains entirely why Europe is more equal than the US. Big policy implications.
2
3
36
There are other reasons to tax wealth, but I'll skip them here. The point is that we need both; capital taxation and capital income taxation.
1
1
35