

Jeremy Schwartz
@JeremyDSchwartz
Followers
20,271
Following
2,478
Media
1,553
Statuses
8,908
Global Chief Investment Officer @WisdomTreeFunds . Host of Behind the Markets @SXMBusiness Powered by @Wharton @SiriusXM 132
Philadelphia, PA
Joined October 2011
Don't wanna be here?
Send us removal request.
Explore trending content on Musk Viewer
BAMBAM
• 256932 Tweets
#BLEACH
• 195503 Tweets
Pete Rose
• 165498 Tweets
PlayStation
• 151283 Tweets
JO1 WHERE DO WE GO
• 77068 Tweets
Happy New Month
• 67027 Tweets
Jimmy Carter
• 61784 Tweets
#ไฟไหม้รถบัส
• 61397 Tweets
#LINEマンガガチャ
• 55817 Tweets
Goff
• 38243 Tweets
सोनम वांगचुक
• 37242 Tweets
Independence Day
• 29538 Tweets
コーヒーの日
• 26248 Tweets
都民の日
• 19931 Tweets
KerjaJOKOWI PRABOWOlanjutkan
• 16227 Tweets
YukBARENG MajukanBANGSA
• 15539 Tweets
Pancasila
• 13287 Tweets
世界4位
• 10870 Tweets
夕刊フジ
• 10229 Tweets


Pinned Tweet

“Powell choosing between 25 and 50 basis points can be likened to a driver descending a winding mountain road going 60 mph when the speed limit says 25. Common sense says he should slow down immediately, not slowly decelerate to 55 as the road gets bumpier.”
-The Prof

2
1
17
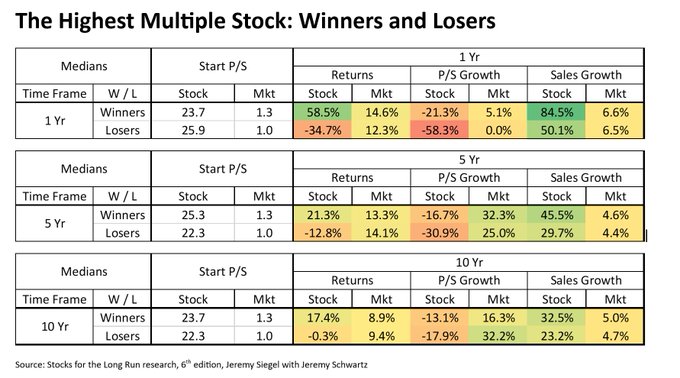
At 40x trail 12m sales, 25x fwd sales, Nvidia is highest valuation stock of any stock in top 500
Odds it out-performs now? 231 companies reached similar multiple last 50+years
Only 20% beat market next 12m.
>90% fail 3/5/10 years.
Median stock loses by 36% next 12m.
🧵👇

76
207
1K
Buffett latest on Japan as Nikkei reaches fresh all time highs.
You should pay heed to this, especially his point on FX: one of greatest mistakes intl fund allocators and managers alike make

12
79
443
The Odds Are Stacked Against You
At a 40x trailing and 25 expected Sales, NVDA joined the club of 99 companies with highest P/S multiple within 500 largest stocks in last 60 plus years.
Some stats on winners /losers from these 99 companies that became THE highest multiple stock
19
54
328
As someone who talks to him live every week on the record and on air—this was as fired up as I’ve seen him..
And he’s been spot on this entire inflation cycle-so I wouldn’t bet against him being right now too…

Jeremy Siegel of the Wharton School ripping apart Powell and the Fed…
“They Know Nothing” 2.0
1K
7K
38K
26
25
319
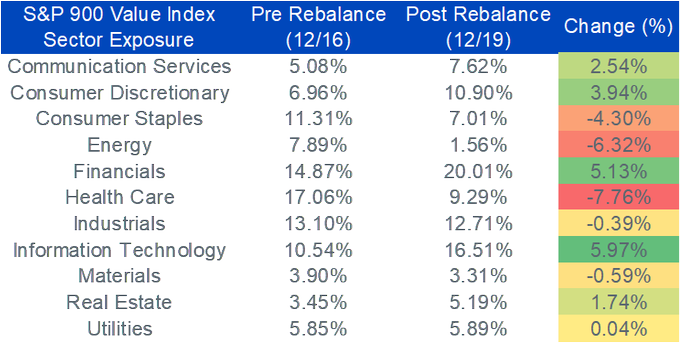
It is end of year rebalance season and we noticed interesting changes afoot in growth/value benchmarks, particularly the S&P family.
Value indexes dramatically cut weight to the cheapest sector (energy), and put Energy stocks into the growth indexes.
What happened? 🧵
10
54
271
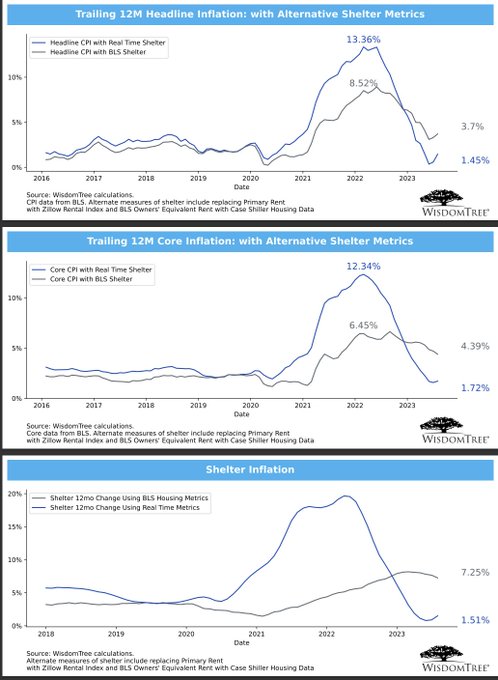
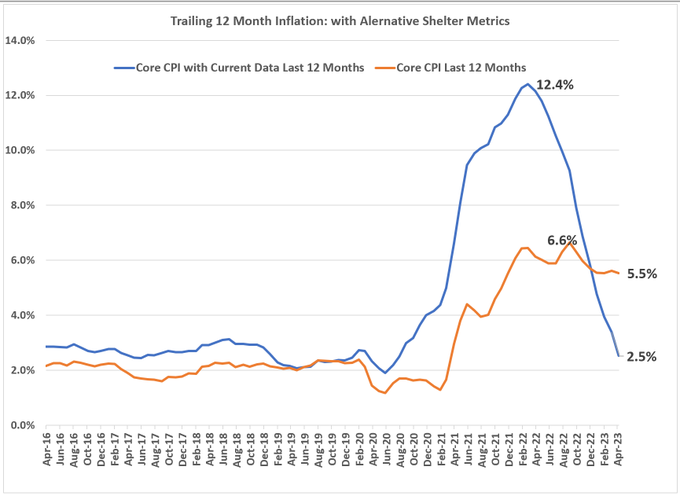
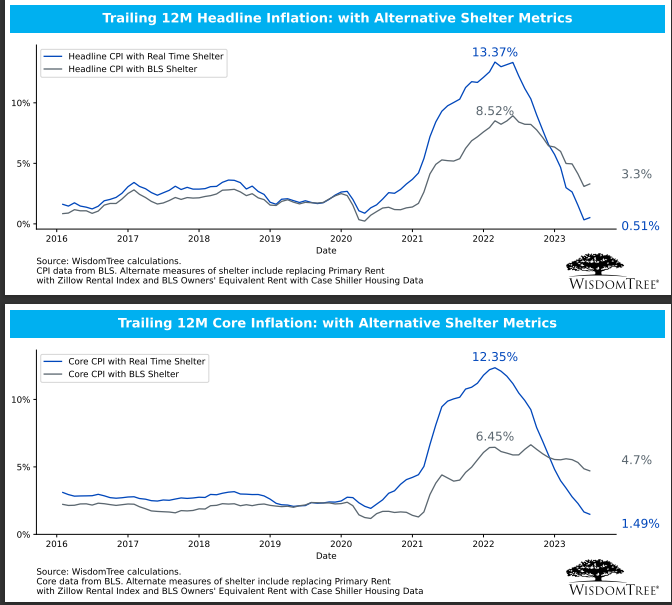
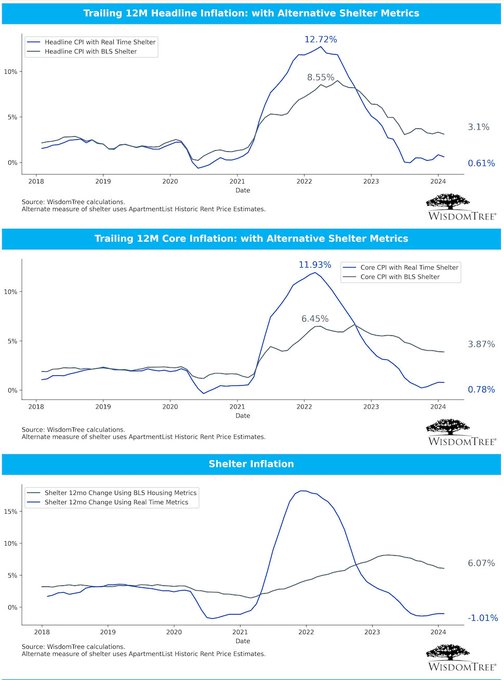
CPI too hot to handle? Alt inflation headline reads out:
Inflation running below Fed's 2% target on both core and headline CPI using more real-time shelter!
Instead of 5.7% BLS shelter, avg of Apt List/Zillow: 1.1%
Let's be careful from over emphasizing too hot headlines!

29
58
234
Alt headline readout from CPI report:
Using real time shelter : we show trail12m shelter as 1.5% (off the lows) but dramatically less than 7.3% official BLS #)
Alt headline inflation: 1.45% (vs BLS 3.7%)
Alt Core inflation: 1.7% vs 4.3% BLS.
The Fed should stop hiking!
13
52
190
Markets cheering good inflation report.
But the real-time data was even better!
Trailing 12m core inflation 3.4%, but subbing in more real time shelter data, gives Core inflation just 1.6%!
Both headline and core below 2% threshold using more real time series.

12
66
213
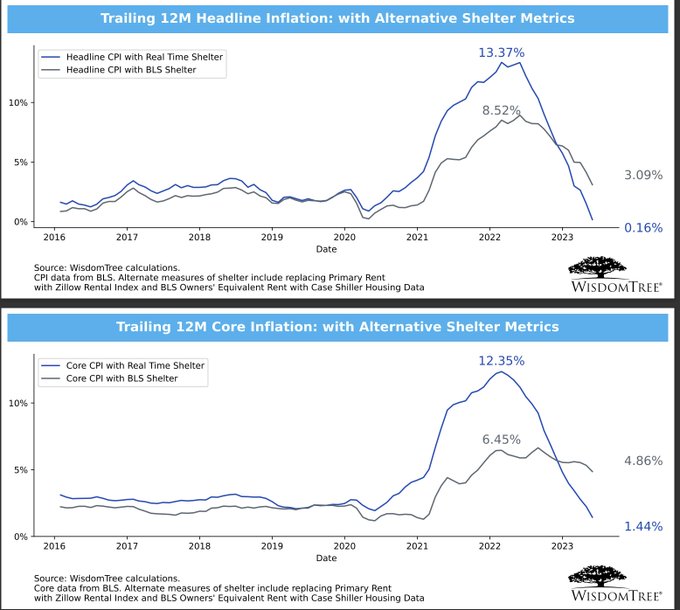
Our alt inflation headline reads out:
Real time headline inflation of 0.16% instead of 3.1%.
Yes that is a 0 handle on real time headline inflation.
Our Alt Core inflation = 1.4% instead of official BLS 4.8%.
Fed should stop the hikes!
17
53
211
Our alt inflation headline reads out:
Fed is closing in on 2% objective, with more real time inflation at 1.4% instead of 4.1%.
9
59
207
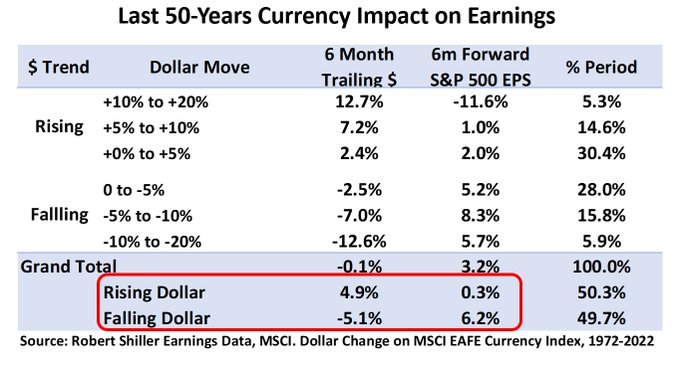
A thread on a not so hidden factor that impacts EPS... and still surprises analysts!
The cheat code for EPS 6M out: the U.S. Dollar change over last 6M
When the U.S. dollar rose over prior 6M, earnings grew 0.3% next 6m
But when the U.S. dollar fell, earnings grew 6.2%
7
43
201
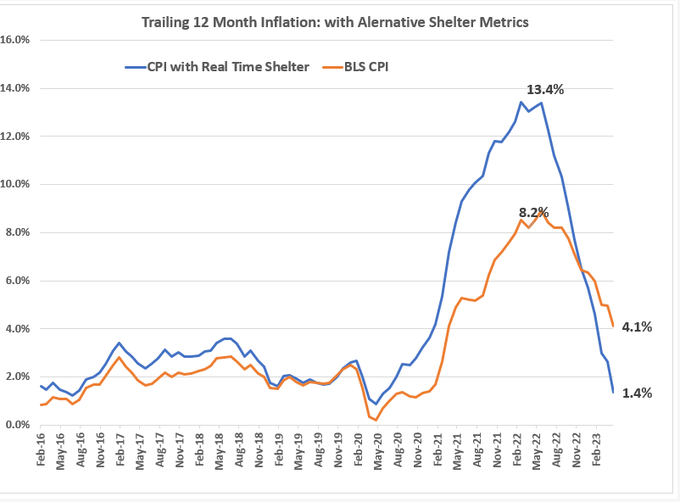
CPI data spurred markets higher but real time inflation is even lower than officially reported.
Inflation trend is not just heading lower.
Core prices, in the real world, are declining!
Annualized core inflation from latest monthly data + alternative shelter calculations.

12
34
192
What if Bears like Tepper and Druck are right?
Below I show the importance of dividends by decade quantifying if market driven by
1) Dividend Growth
2) Rising valuations
3) Avg Dividend yields
Digging into US, Europe, Japan.
Our 2020s theme: a decade for dividends
🧵👇
9
25
175
Is it time to get long EM?
Join our space Monday 5pm EST with
@seemacnbc
co-hosting a discussion with
@MatthewsAsia
portfolio manager Michael Oh, WisdomTree China expert
@liqian_ren
and India expert and friend
@_Gaurav_Sinha
.
3
24
143
CPI Core coming came out at 5.5%.
Our Alt CPI Core down to 2.5% --down from 3.4% last month and 4.8% in January.
How many months until our Alt-core goes negative?
17
27
154
Some math on total hours worked - despite 339K jobs created, total hours worked declined!
With a 0.1 avg hours decrease, needed 453k added workers to keep total hours worked constant.
Headlines should have read jobs miss when factoring in these hours worked.

15
41
147
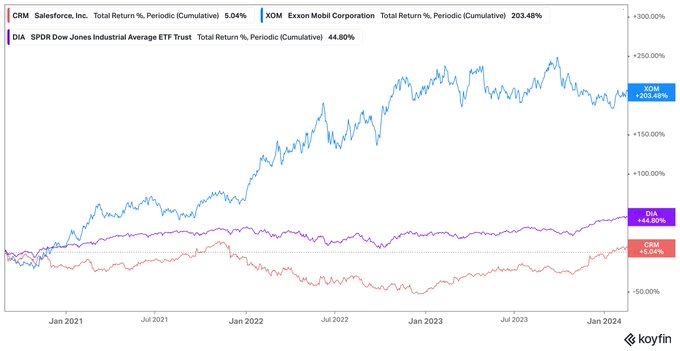
With Amazon getting added to Dow: is this a signpost of 2020 tech inspired changes to the key gauge?
$CRM: Salesforce was added August 31st 2020 to replace Exxon.
How did that work out? 👀
9
34
146
Alt CPI update:
Still printing sub 2% when you put in real time shelter.
Puzzling or not on stickiness of BLS shelter: real time data shows Fed is actually on track and can afford to cut rates.
Don’t rule out July cut possibility.

14
33
143
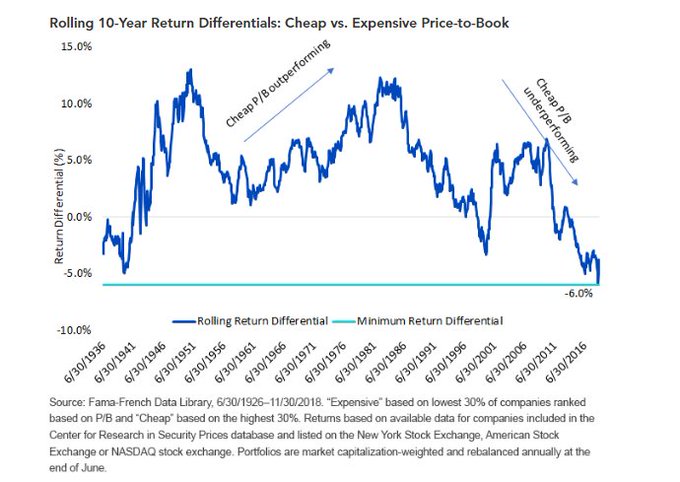
We all know Value and Price to Book has had a terrible decade. Interesting that last 10-yrs was the single worst decade going back to Fama French data started. See my note on factors determining whether it will turn around: .
3
49
140
A dashboard of regional returns over last 9-years highlighting what drove US out-performance over foreign markets decomposing:
P/E Multiples, Profit Margins, Sales Growth, Dividends & ForeX
-Japan, unloved, beat Europe, EAFE, EM on Margins. Lost most on FX, Multiples

12
35
142
S&P 500 trades at 20x fwd PE / 5% earnings yield, implying 7-8% nominal returns over 5-7 years
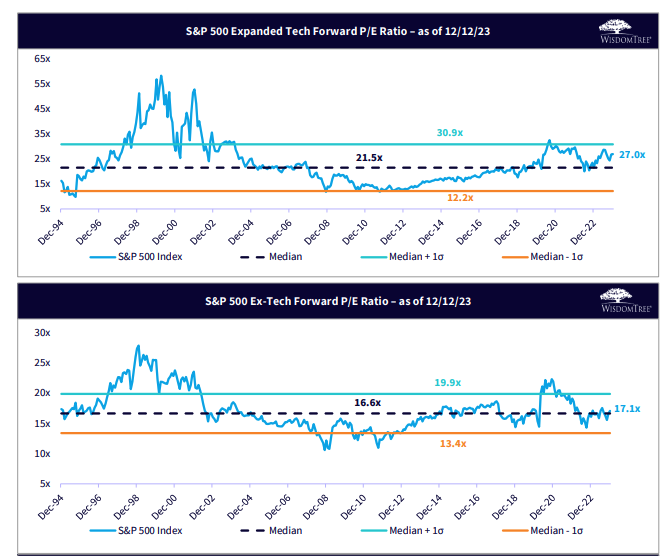
There's a 10 point spread between tech and non tech at 27PE for Tech and 17x for ex-Tech in large caps.
A number of small cap strategies trading around 12-13 PE or 7.5-8% earnings
5
25
131
Sheila Bair to CFA event: “European banks are in better shape than US banks to my embarrassment.”
She gives credit to
@ecb
stress tests being more stringent and better than
@federalreserve
stress tests particularly calling out tests sensitive to inflation, rates being better
4
31
121
Surprise: shelter strikes again.
Real world headlines read out much cooler.
When we put in Apartment List rent (which declined -1% last 12m) vs the +5.7% BLS, we see both core and headline CPI printing both <1%!
Hearing much more commentary the Fed 'gets it' now.

10
39
120
Our alt inflation headline reads out:
Real time headline inflation of 0.5% instead of 3.2%. Yes still a 0 handle on real time headline inflation
Our Alt Core inflation = 1.5% instead of official BLS 4.7%.
At least the SF Fed acknowledging shelter inflation bias!
5
39
110
Exhibit A of fundamental disconnect between small and large caps:
Russell 2000 no prices gains over 3-years, lagging S&P 500 by >25% cumulatively.
Yet trail 12m dividends grew more in small than large caps
A case for broader market participation in 2024 in one chart:

10
17
102
Coming soon (expected 12/20 list date):
WisdomTree Bianco Total Return Fund (ticker WTBN) – tracking the Bianco Research Fixed Income Total Return Index.
We’re excited to be collaborating with
@biancoresearch
on this new ETF!
9
18
98
PPI surprise: 40% in July advance tied to rising prices for portfolio management. 🧐
What is going on here?

7
15
99
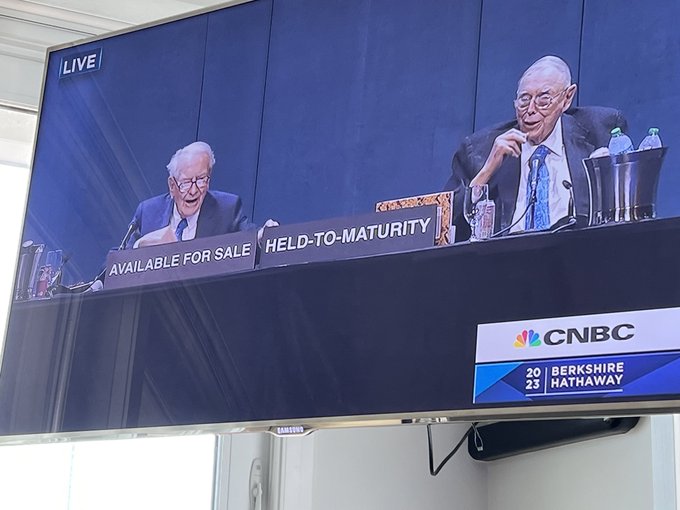
My biggest takeaways from Buffett first half Q&A
-“Don’t tell the Fed” but the >5% yields are having him grow his cash pile because hurdle rates so much higher than when 1% Fed funds was the alt”
People keep trying to add to duration but cash rates so attractive
-Why reduced
12
27
95
BTW hot new cover art for this new edition now on Amazon pre-order. Some personal news included 🤗

Some updated charts from Stocks for the Long Run, edition 6 (forthcoming in September) to illustrate this point of riskiness of cash to succumb to inflation, while stocks provide good long-run after inflation returns.
4
5
32
15
10
94
BLS report today: ‘shelter rose 0.4 percent in July, accounting for nearly 90 percent of the monthly increase in the all items index.’
But as you know by now, that is a badly lagged series.
Subbing in more real time shelter data from Apartment List and Zillow, we see
5
27
92
Anticipating a few questions on banks… brought some props —-😂
9
6
85
We produce a daily dashboard that is one of my favorite docs and just dropped some new charts in it.
First on equity premium: one of bigger chart crimes I see on this website.
Earnings yields should be comped vs TIPS yields. Yes we are well lower than last 30-years but 2.5%

7
15
87
A 50 bps cut should remain on the table
Updating CPI w/ real time metrics on shelter shows inflation at half official levels!
Alt-Headline CPI: 1.2%
Alt-Core CPI: 1.6%
Forget claims aggressive Fed cuts indicate panic!
The Fed should not be complacent: get to a neutral policy

12
20
84
Looking at Core CPI, you could say 3-month annualized impulse of inflation ticked higher.
But updating Core CPI with real time housing data, we now have 5 consecutive months of Core CPI printing negative. Price declines...
Reiterating: the Fed is too tight..

8
25
81
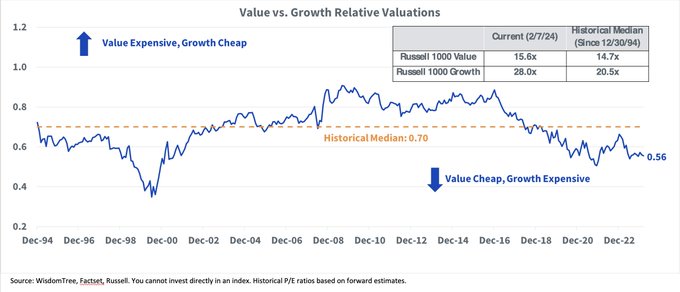
Update on valuation ratios:
Large cap value usually trades at a .7 multiple to large cap growth. Today at .56.
Small caps last 20-years sold at premium 1.07x large caps and now .7 and 30% discount.
Will these ever revert back? We think so....

4
15
82
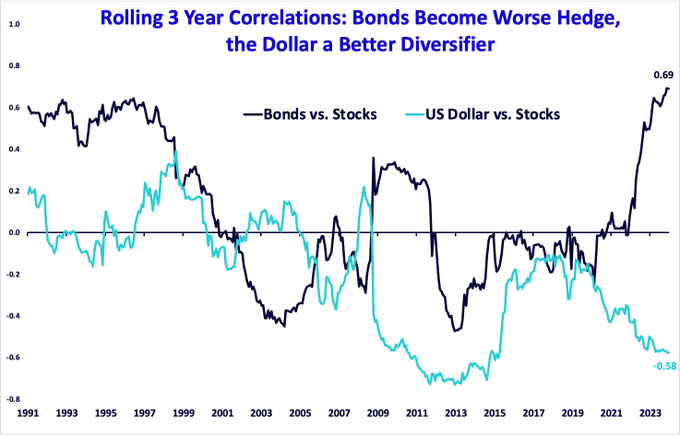
I know we're all focused on new currency ETFs that launched last week, but another currency also has my attention.
The market has become all one trade: Stocks/bonds showing highest correlations in decades.
60/40 portfolio diversification worsening as the bond market is driving
6
17
81
Alt-inflation headline read out:
Using more real time series for shelter, both alt-core and alt-headline below 2%.
Alt-Inflation below Fed 2% target ✔️
Our alt-shelter # hooked higher off lows but is 2.6% and not >7% like official stats.
Fed should be done with hikes!

6
27
80
Buffett: “You have to get a punishment for people doing wrong things. First Republic was offering non government guaranteed mortgages for 10 years. It was in plain sight.”
3
10
80
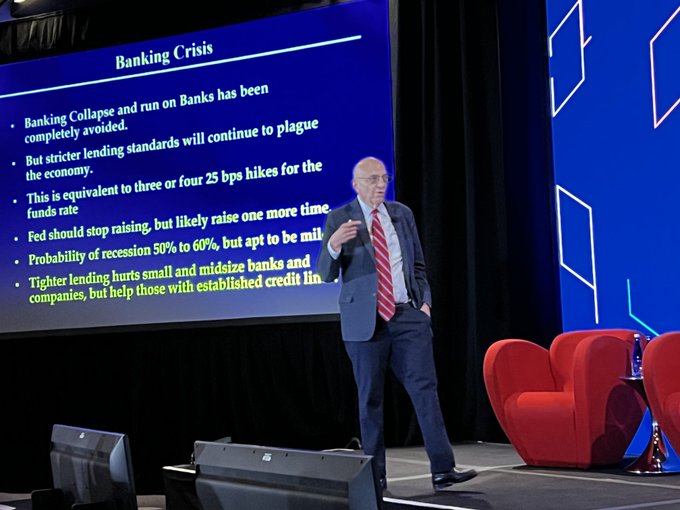
We have Prof Siegel on stage right as Fed is announcing latest policy at CFA event
“Failure to regulate banks as big of failure as calling inflation transitory” and the tightness in credit lending is equivalent to 3 or 4 hikes….
@CFAinstitute
9
7
81
“There’s going to be two more rate hikes -no one cares about your lack of housing inflation cold takes”
- “No, there will be 3 more hikes”
-CampKotok Sunday night deck talks
@SamuelRines
@biancoresearch
@DiMartinoBooth
@Interdependence

15
10
74
Twitter fam-my daughter needs your help.
The most likes gets a free skateboard. Can you help her out here?
@FutureProofAC
@Vetta_Fi


6
3
79
Buffett: would have bought a lot more banks without the bank holding company act.
We sold bank stocks when pandemic broke out and last 6 months more. I don’t know what shareholders are going to get. American public as confused about banking as ever. Every event creates a new
11
13
78
The next big story for markets will be what happens to EARNINGS in an inevitable slowdown.
We’ve added to our webtools a dynamic dashboard to visualize the Earnings PATH across
S&P 500, 400, 600, select styles +all of our indexes.
A visual 🧵on our EPS PATH tool >>>
1
5
77

This would probably stack up as the most contrarian trade out there... trading into small caps vs the Nasdaq, at extreme wides and only parallel to 99 top in tech; by
@jkrinskypga
at
@chartsummit
cc
@JeffWeniger

7
19
72
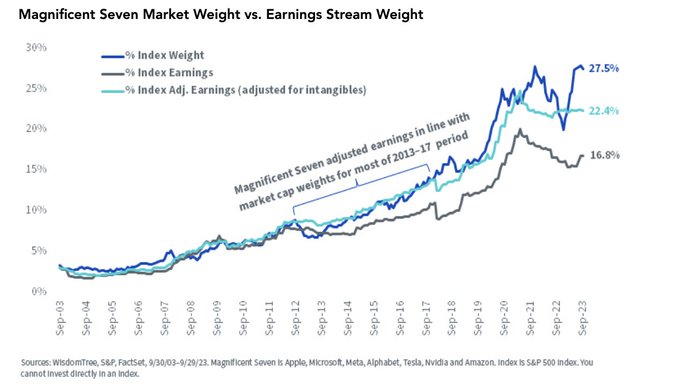
A new look at Magnificent 7 valuations: not as frothy as first blush. 🧵
4
21
72
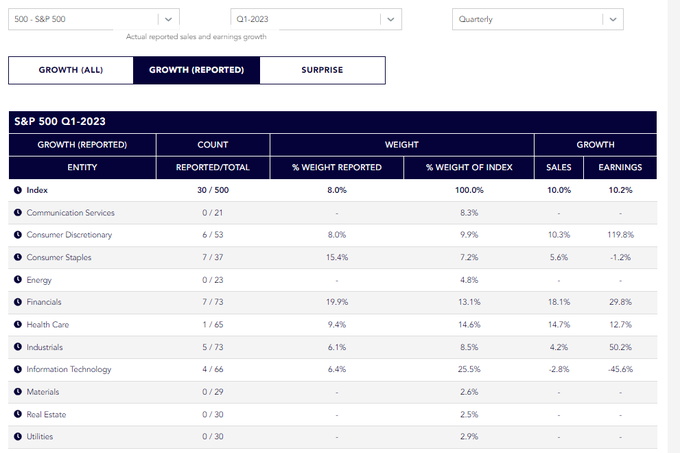
We are up to 81 companies reported in our Earnings Path tracker this am.
S&P 500 sales: +7.4%, earnings -1%.
But 'surprise' : sales up 1.6% more than analysts estimated; EPS 6% beats.
Consumer Discretionary surprise +20%.
Link for daily updates


As we get into heart of earnings season, if you want a new free daily dashboard to track how it is going by sector - with levels and surprises- a new Earnings Path tool.
Can select by Index today and eventually more funds.
Bookmark that page!

2
2
31
7
8
72
Twitter team: we won best allocation launch of 2018 award at
@ETFcom
! 🙏🙌 h/t
@CliffordAsness
@EconomPic
@Nonrelatedsense
@choffstein
@EricBalchunas

8
3
68
Good morning all!
Our friend
@RyanDetrick
published this great chart on small caps and odds for good returns ahead
July's rally was led by low quality small caps on rate cut hopes
We favor quality for navigating this cycle and over longer run. New blog

4
13
71
60 minutes segment -pre pandemic 1 in 67 jobs were remote and now 1 in 7. Chief economist at LinkedIn says this trend towards workers desiring flexibility is permanent and we’re not going back. Personally speaking here—I agree
4
5
67
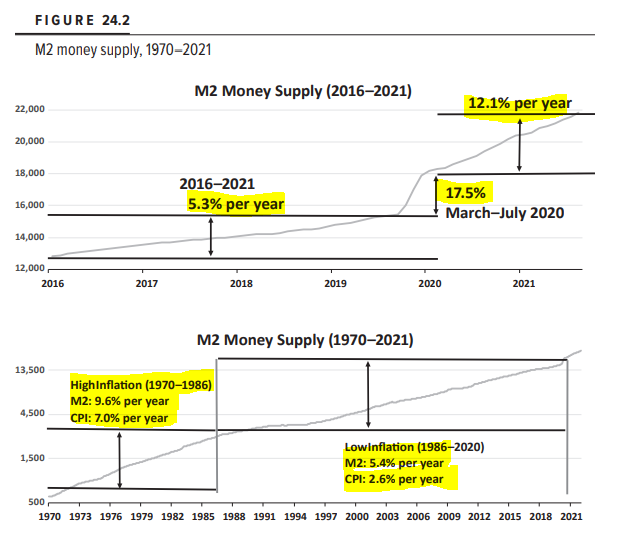
M2 is 3% off highs and negative on a y-o-y basis.
JSiegel on long-term relation between M2 /inflation.
From '70-86, M2 grew 9.6% per yr, CPI 7.0%
From '86-2020, M2 grew 5.4% per yr, CPI 2.6%
M2 explodes up- CPI follows.
But now M2 negative!
The Fed is WAY too tight!
5
20
68
Quick thread on Buffett's $6 billion purchase of Japan's five SogoShosha, general trading companies, from our Japan strategist--Jesper Koll. Apart from the usual reasons for Buffett to invest — cheap valuations, great cash flow- some added considerations.
2
16
67
An update to our inflation lens using latest Case Shiller housing numbers to get different view at inflation impulse:
Conclusion: inflation is not just coming down, but core CPI prices are declining.
Inflation was much higher than official stats in 21.
Now much lower!

1
15
63
1/3
I was trained in the value school
@Wharton
, but if I were to make a case for growth stocks- the following combo of charts would be the story.
EPS Growth since 2020:
> 126% for Mag7 ;
>> 26% for S&P 500 ex Mag7

1
18
64
Energy to me still looks like the cheapest sector in aggregate.
No sector with a lower PE multiple.
Yet.....
1
7
63

A few chart updates with our CPI calculations that include alternative shelter components.
Officially CPI shos headline inflation of 5.0% last 12m, our calculations show <3%:
Inflation was much higher in reality before and now much lower.

6
14
60
The after picture -approx 10 hours later. We made it! Proud of everyone especially my wife who I pressured into coming. Great time on trail with
@millerak42
@EricBalchunas
@preston_mcswain
#MFTF

3
4
59
What an honor to be first guest on inaugural ETF IQ show w/
@EricBalchunas
@scarletfu
-so proud of team here at BBG-Eric’s been working on this a long time!
2
7
59
A lot of hot takes on inflation print + looks at super core ex important yet volatile items
We calc Alt inflation using Apartment List Rent in lieu of BLS Shelter>>
Alt inflation core and headlines read out sub 1%
Real inflation well anchored / Fed should look thru the noise!
6
19
59
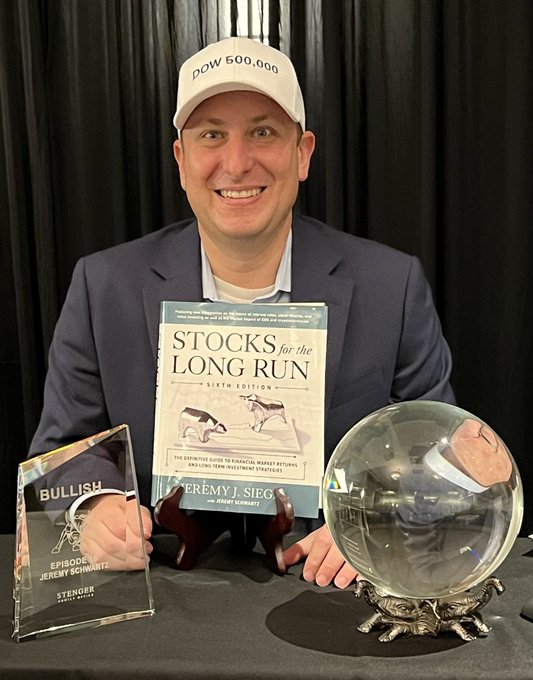
This was my first podcast that brought a crystal ball to our live event with special Dow target hats for the end of our careers.
My over /under is 45 years from now -a 6% return -before I turn 90 god willing.
🙏to Nick Stenger’s bullish podcast
0
4
59
With Case Shiller HPI release, an update to our Alt-CPI metrics using latest real time housing data
Case Shiller ticked higher 3m in a row but...
Our real Time shelter inflation still +1% vs 8% in BLS
Alt Headline Inflation to 1.5% last 12m
Alt-Core inflation 2.2% last 12m

2
18
55
@choffstein
Those 6m T-bills wont stay that high over longer run is what market is saying.
+ Stocks are real assets - over time earnings and dividends grow with inflation.
More important comp is vs 10-year TIPS yields and those are on par with averages...

6
4
56
@WeLivetoServe
@cullenroche
@hmeisler
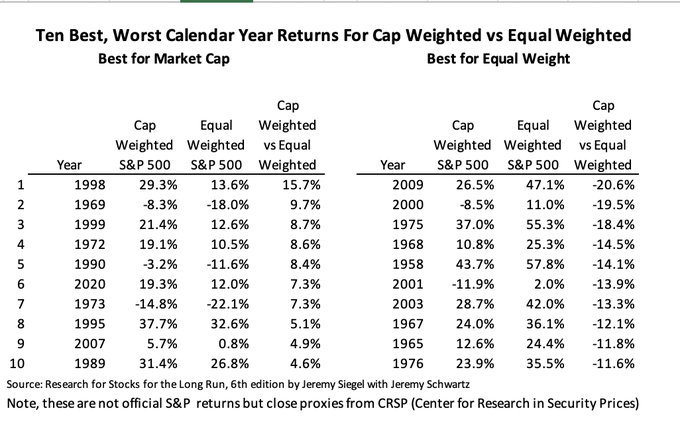
Some data from our archives on the difference between cap weighting and equal weighting going back to S&P 500 inception in 1957....
In last 65 full calendar years (1958-2022), market cap weighting beats equal weighting only 25 of last 65 years.
Relative return for cap vs equal

4
12
57

For those wondering how much training is minimum to make 28 mile march next yr: Bonnie didn’t train outside regular yoga classes. She showed up saying let’s see how far I can go & didn’t stop.
@MebFaber
crushed it with no training. It’s mental toughness. No excuses next yr :)
The after picture -approx 10 hours later. We made it! Proud of everyone especially my wife who I pressured into coming. Great time on trail with
@millerak42
@EricBalchunas
@preston_mcswain
#MFTF
3
4
59
4
2
54
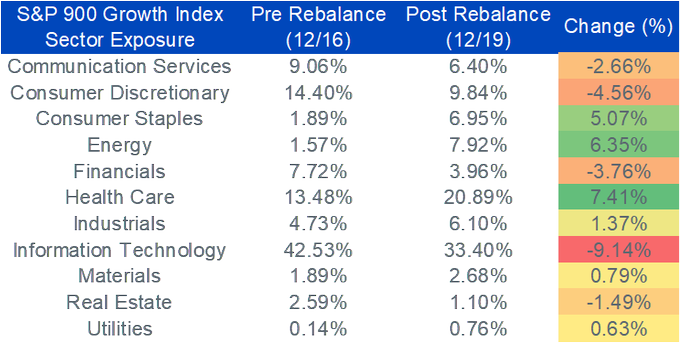
First up changes in growth and biggest adds: Health Care, Energy, and Consumer Staples.
Notably, these were the three sectors with best performance.
This is less what sectors have best growth prospects-but rather what had best performance
1
5
56
Valuations of 'expanded tech' vs rest of S&P 500.
Forward P/E of Tech about 4 points and 20% above last 20-year median, while excluding 'expanded tech' we are right at the 20-year median....

1
8
56
Key chart why Siegel is so miffed on Fed policy
We get updated data 1pm: M2 money supply.
From ‘70-86, M2 grew 9.6% per yr, CPI 7.0%
From ‘86-2020, M2 grew 5.4% per yr, CPI 2.6%
M2 trends 5% per year then balloons 17.5% in 4 mon + 12.1% per year.
Inflation must follow ✅

2
10
53
Munger pessimistic on value investing as there is more of us going after it.
Buffett defends it-“what gives you opportunity is people doing dumb things. And in 58 years we’ve been running Berkshire there has been an INCREASE in people doing dumb things—easier to get funded.”
3
7
53
Would you believe this is first time were out to dinner in downtown Philly in over a year. 🤷🏼♂️

1
0
53
Despite energy being lowest PE sector, weight in S&P value reduced from 8% to sub 2%, lowest weight!
Health Care also cut significantly.
Tech showing up here on negative momentum, not overall cheapness.
1
9
50
Today's inflation data was even better than reported headline figures!
Subbing in more real time shelter, headline inflation was below 1.7% and core inflation below 1.6%.
Updated alt inflation charts here...

3
10
52
Always enjoy listening to the Facts vs Feelings pod with
@RyanDetrick
and
@sonusvarghese
.
This week a special green episode on why This Isn't A Bubble.
We agree! Sonu shouts to our daily dash on tech vs non tech - link for daily updates below.

5
12
53
Buyback haters will not like this note... If net buybacks were used on top of dividends alone as a value factor over last decade, performance impact was substantial: over 300 bps a year increase over dividends alone in top quintile: repurchase responsibly:
3
9
49
Siegel’s call for immediate rate cuts is NOT an indication of a Fed ‘panic’ like you all are saying. It is just being consistent with the Fed’s own Dot Plot and narratives.
Powell is being too deliberate and slow in not wanting to ‘surprise’ the market.
Below was the June Dot


"I'm calling for a 75 basis point emergency cut in the Fed funds rate, with another 75 basis point cut indicated for next month at the September meeting - and that's minimum," says Wharton's Jeremy Siegel:
526
742
3K
10
9
52
Important personal and personnel news just crossed the wires.
@WisdomTreeETFs
added a new Director of Modern Alpha to our team this morning. Liqian Ren joins us from Vanguard where she ran their active factor funds. Very exciting development!
3
2
49
Our latest tracker for S&P 500 earning season:
Still early in reporting season but estimates trending to 3.7% sales growth and 5.2% earnings compression comping Q422 vs Q4-21. Will keep this updated every week.

4
8
47
Thanks to
@CliffordAsness
for pointing out his ‘96 paper on the levered 60/40 - we updated his analysis work -the levered 60/40 worked better over following 25 years than during his original piece. Who said research never works out of sample!

2
2
47
New all time low in
@truflation
alt and more real time cpi data.
Reinforces case Fed is behind the curve and should get to neutral quickly 👇

A 50 bps cut should remain on the table
Updating CPI w/ real time metrics on shelter shows inflation at half official levels!
Alt-Headline CPI: 1.2%
Alt-Core CPI: 1.6%
Forget claims aggressive Fed cuts indicate panic!
The Fed should not be complacent: get to a neutral policy
12
20
84
2
13
48
A look at overall P/S of tech vs the market. The whole tech sector not as high as tech bubble on this metric at moment.

4
12
47
Will the Growth of Indexing Lead to Its Downfall?
Fresh study on how recent adds/drops to S&P 500 have performed-- we are working to update our paper and analysis on the Original S&P 500 stocks vs continuously updated S&P 500. Stay tuned but
New blog
3
8
46
A little late but let me add to pile on of gratitude to
@CliffordAsness
for his work on how a levered 60/40 was better diversification than 100% equities alone from his 1996 paper. Real time stress tests of his paper 24 years post pub -results below! 💪
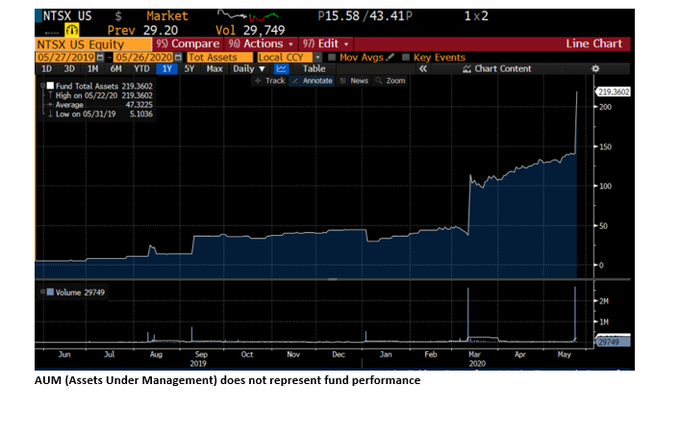
Milestone Alert! Big day for flows into $NTSX last week taking AUM to >$215M. What’s driving interest? Performance. [A thread coming]
6
2
29
2
3
46

Behind the Markets w/
@profplum99
Chief Strategist, Portfolio Manager
@SimplifyAsstMgt
out now.
We get Mike's take on
1) The Economy - and how he has positioned the Macro Strategy he runs for Simplify
2) Volatility - How does 0dte options impact VIX and the term structure of
4
7
41
Buffett: “the world is overwhelmingly short term focused and that is world made to order for anyone thinking long term. Would love to be born today”
1
10
44
Prof Siegel says at current valuations, the S&P 500 is priced for 5.5% real (after inflation) return over the next decade. Little known tidbit: for dividend weighted large caps, that outlook needs almost no growth in fundamentals. Current steady state

0
12
43
Got TIPS?
@biancoresearch
does via his new fixed income index.

Longer-term US inflation expectations have fallen dramatically over the past two months, to close to the Fed's 2% target.
65
303
1K
5
7
42
🛢️: for a sustained move in oil
@WarrenPies
wants to see more than short covering of recession trades. Singapore crack spreads > $20 would signal better China demand.
@3F_Research
views on economy, markets, commodities and real asset allocation!
🔉pod
4
16
42
When stocks become the largest multiple stock among top 500 like Nvidia is now, momentum can take them higher.
99 separate companies became largest multiple stock in our study.
Over next 12m - median o 99 out performed.
But next 3/5 years, they typically underperform >10%
1
3
43
Why is large beating small by so much YTD?
Earnings expectations are holding up much better for large caps than small caps this year.

2
4
42
Alt Inflation update: we're working on new calc of CPI with more real time shelter
While BLS shelter printed >6% last 12m, Apartment List rent index: -1%.
Real time rent indexes from Cleveland Fed showing even bigger declines of -5%!
Alt inflation core+headline now <1%!

5
12
42
On the 15-year time period, remarkable how similar foreign indexes were across Dev Intl, Japan, Europe, EM.
S&P 500 out performed each by at least 7 points.
Foreign markets no sales growth, expect EM which rivaled US. EM lost on Fx and multiple compression

1
7
42
Latest summary of EPS seasons from our Earnings PATH tool with >50% of S&P 500 weight reported.
-S&P 500 earnings were expected down -6.7%;
>>>now running -4.7%.
-Not all size segments surprising higher though
- Small and small value disappointing. More below.

4
6
41
And can see momentum is 1/3 of the S&P growth factor definition.
There is also an intersection of growth and value scores/and some companies are split between growth and value.
Amazon became weighted in value, while Exxon and Chevron became pure growth stocks. 🤷♂️

2
3
41