

Erwan Rivault
@ErwanRivault
Followers
2K
Following
2K
Media
273
Statuses
477
Data visualisation designer @BBCNews | previously @ESA_EO
London
Joined September 2019
Nitrogen Dioxide concentrations dropped over China in January as a side effect of #coronavirus, but it is now increasing slowly again as the situation improves there. Download & read more 👉
68
927
2K
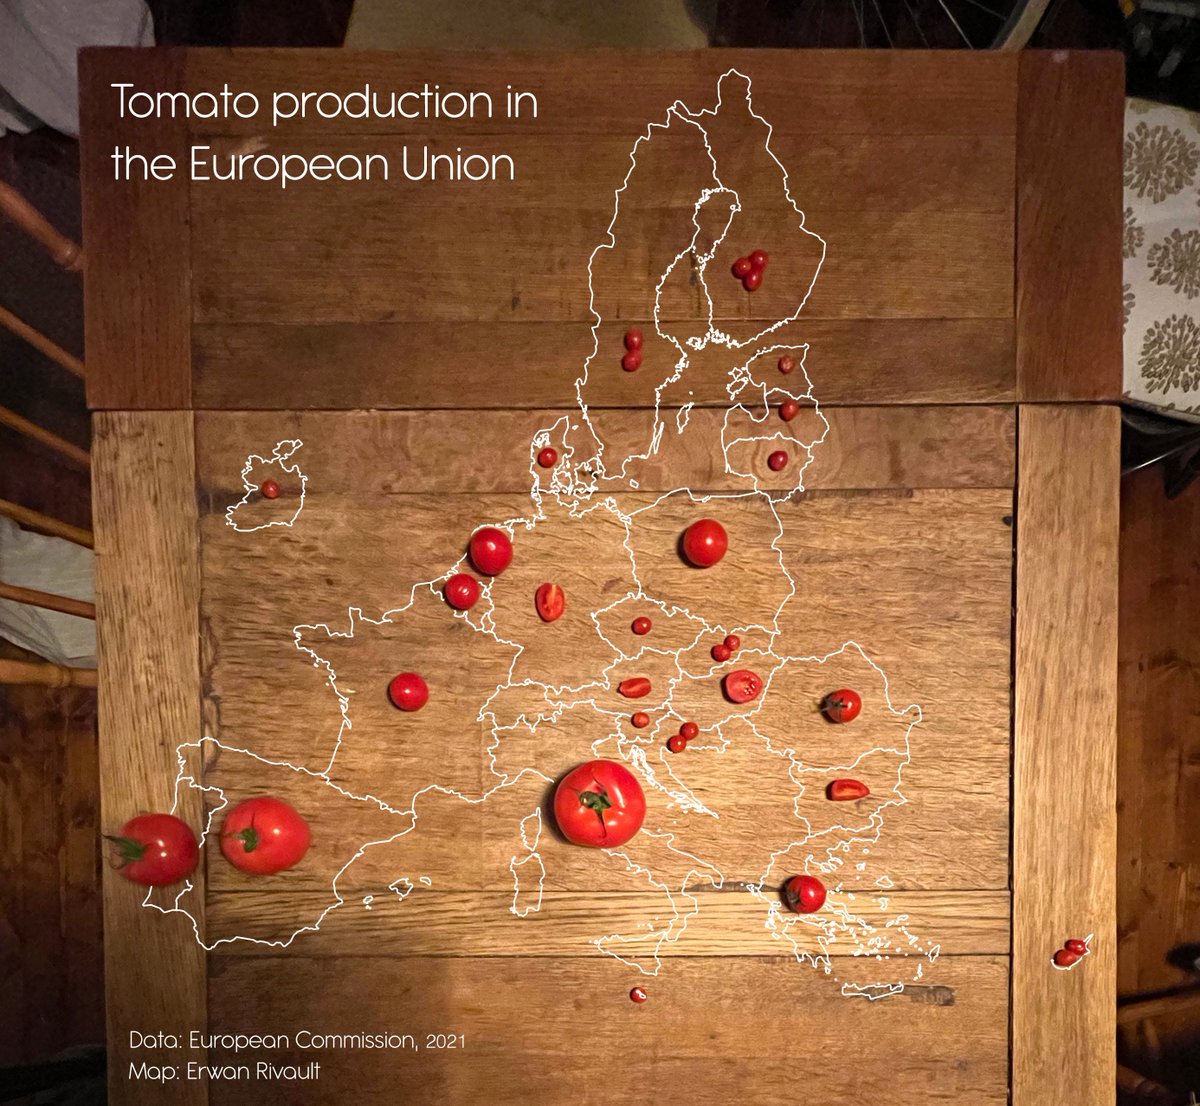
#30DayMapChallenge Day 5: Analog map. Had to buy so many different size of tomatoes to make this work!
14
108
922

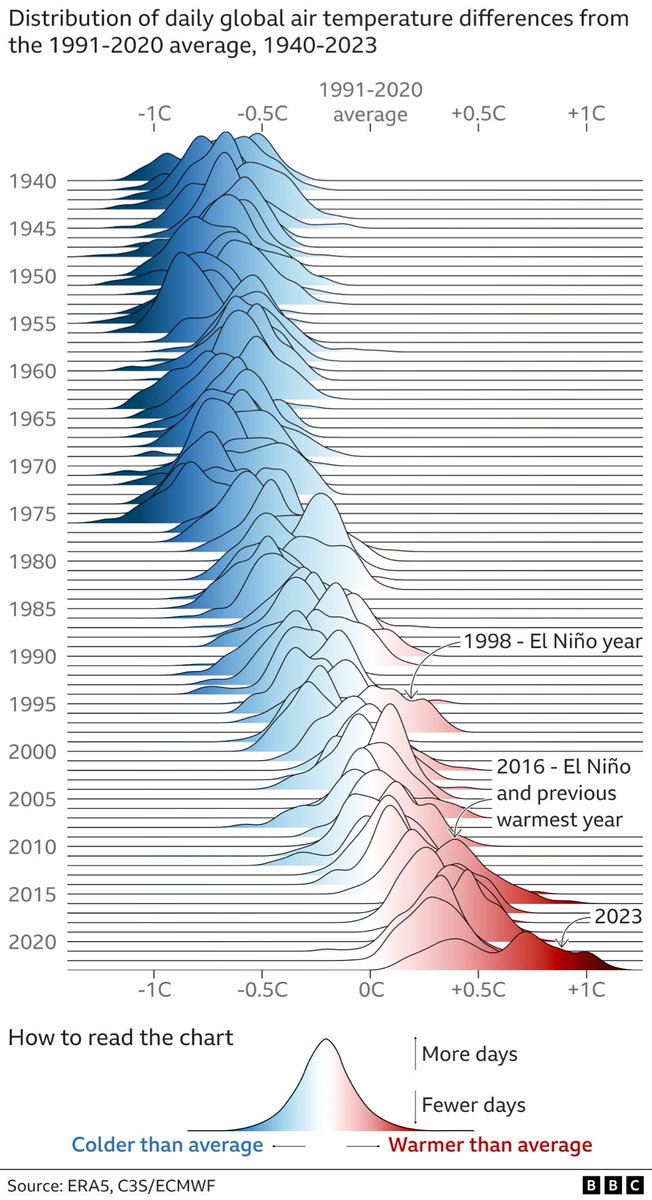
NEW: 2023 has just been confirmed as the warmest year on record. The second half of the year saw record numbers of new daily highs. We used a Joy Division plot to visualise daily temperature anomalies since 1940 to show how different 2023 has been
16
167
493
#30DayMapChallenge - day 12 - Map not made with GIS software. Re-created Venice with the amazing #Townscaper.

2
28
367
Canada wildfire smoke makes New York air quality worst in the world - here's how it happened.
16
65
280

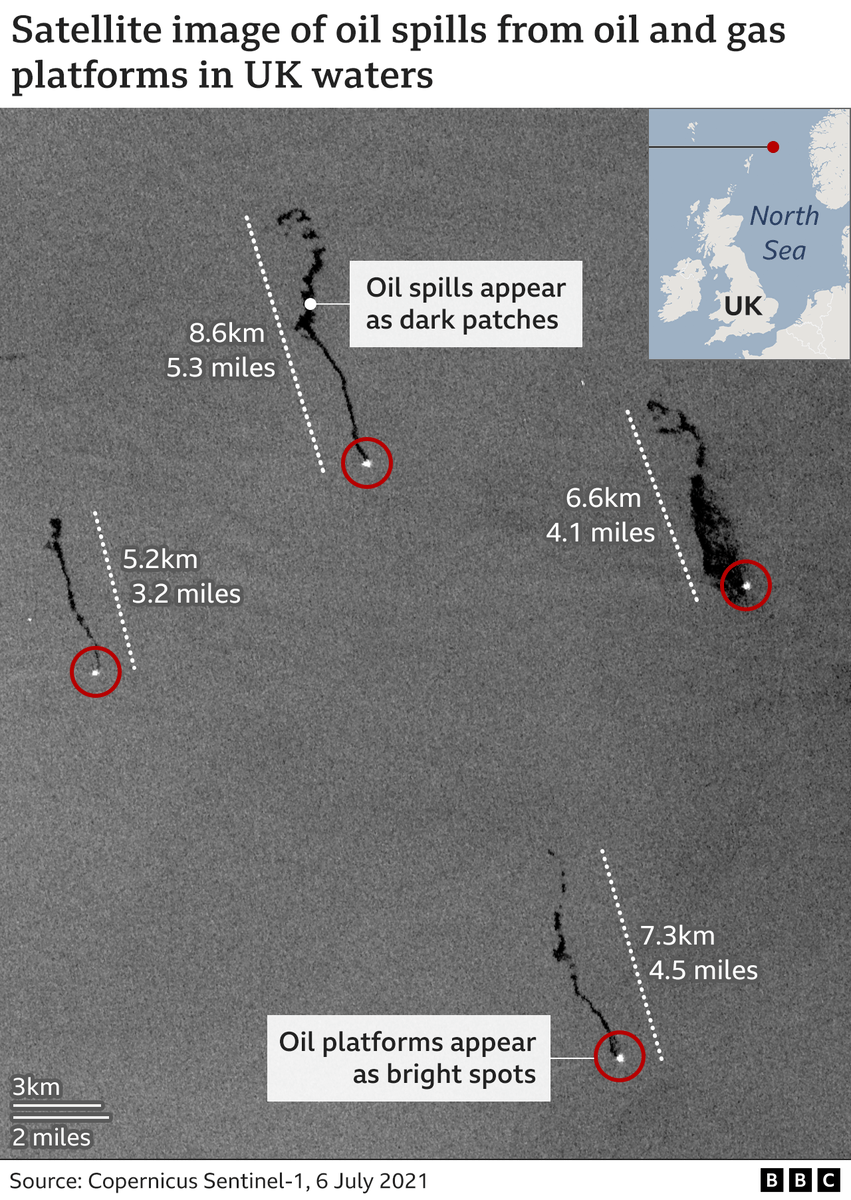
Oil spills from offshore platforms in the North Sea revealed by radar satellite imagery and FOI requests. This is the most impressive @CopernicusEU Sentinel-1 image I could find, 4 oil platforms, 4 oil spills
5
72
223
New animation 🎉 I used sea ice concentration data from AMSR2 and processed by @PolarBremen to map the journey of A-68 iceberg. Our full story 👉
6
44
158
#30DayMapChallenge Day 12: South America. Mapping forests as mountains with @GEDI_Knights data

2
24
163


#Rennes sous la neige aujourd'hui, vue depuis le satellite Sentinel-2, à 786 km d'altitude ❄️

4
27
143
#30DayMapChallenge Day 2: Lines. Reducing the number of lines needed to draw France (about 20 times)
3
8
135
Visualising Gaza population density in 3D to better understand what Israel's evacuation order means. More than 1 million people, living in the most densely populated area of Gaza, are expected to move south of the Wadi Gaza riverbed.

3
49
125
Some highlights from my first 9 months at @BBCNews!. Had the chance to work on some exciting topics such as climate change, elections, natural disasters, Ukraine.


1
13
118
New @CopernicusEU Sentinel-3 satellite image from this morning shows the extent of flooding along the Dnipro River (this is using near-infrared)

3
61
108
Okay, Mount Taranaki really is an almost perfect volcano
5
16
116
#30DayMapChallenge Day 1: Points. Is France the country of roundabouts? Well, this is what you get if you map all of them.

6
11
109
A visual comparison between satellite observations and model output. Both show the Aerosol Index of the last month, when huge amounts of dust travelled from the Sahara to the Americas.
2
44
101
Be ready to see a lot more Blender elevation in BBC News graphics!. Turning what could be a boring map into something a bit more exciting #Blender3d #b3d

2
9
100
The Kakhovka Reservoir appears almost completely dry following the destruction of the dam 2 weeks ago. We analysed satellite images and talked to experts to understand the consequences for the region. A little thread of satellite images 🧵

5
50
92
#30DayMapChallenge Day 6: Asia. Air pollution in India mapped in 3D. The biggest spikes are from power plants, not cities.

3
8
91
#30DayMapChallenge Day 8: Africa. All African rivers mapped by Strahler stream order and coloured by basin

8
16
90
#30DayMapChallenge Day 3: Polygons. Mosaic painting of the US, using Voronoi polygons for all cities with at least 10k population

4
8
81
Having 4 consecutive Sentinel-2 cloud free acquisitions is quite rare, especially over the Netherlands. But when you do, you can see subtle changes every 5 days, like the tulips blooming this April.
0
26
81
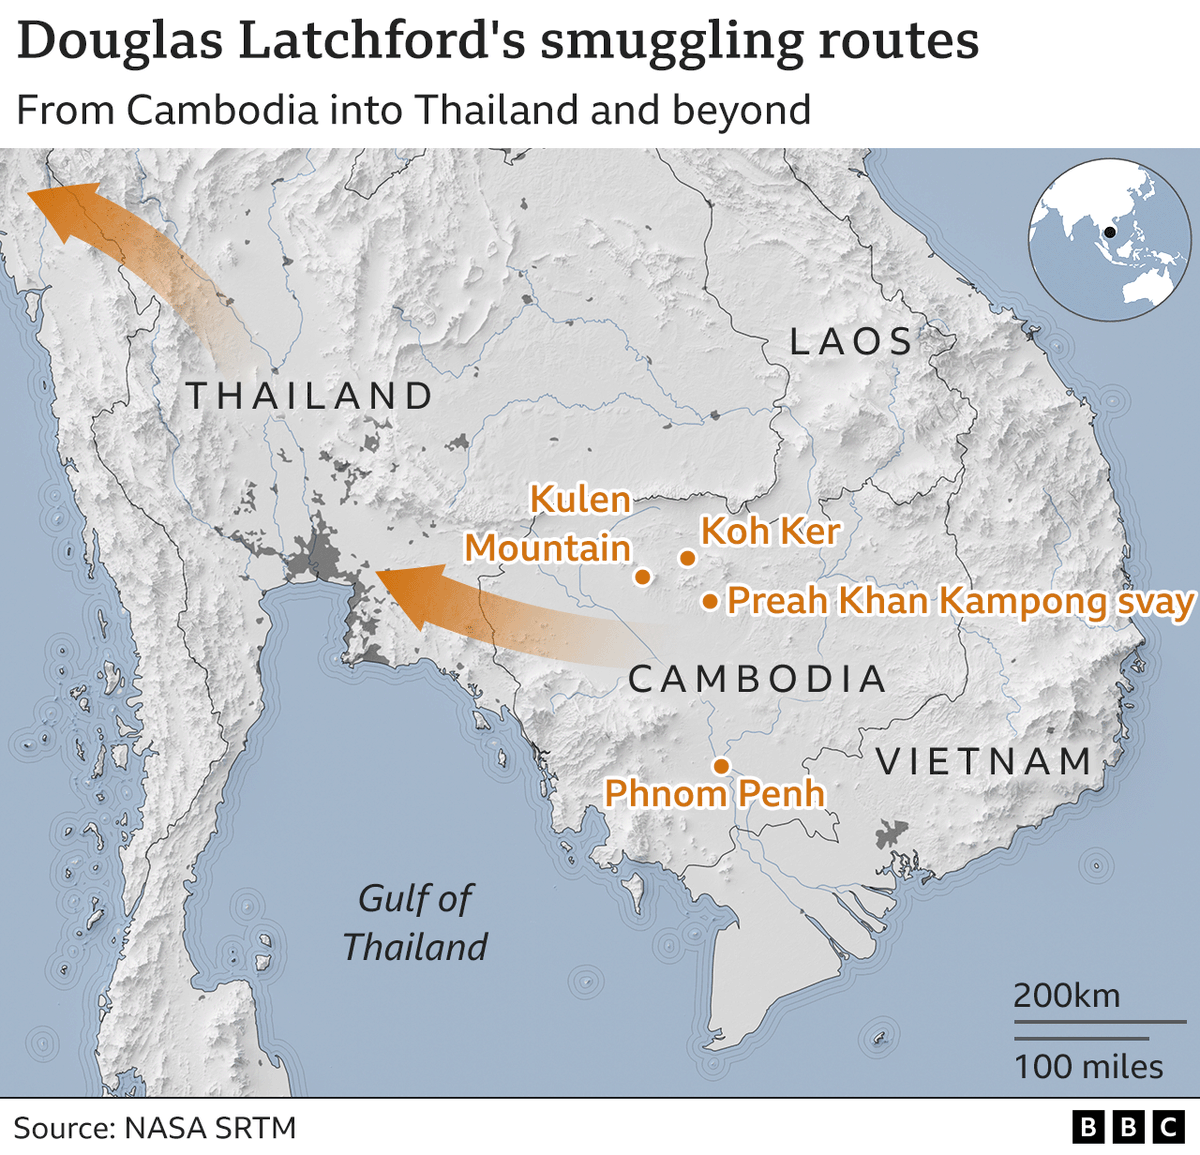
More than 2,000 dead in Turkey and Syria after major earthquakes. Understand this tragedy in just 4 maps by @mark_bryson and me

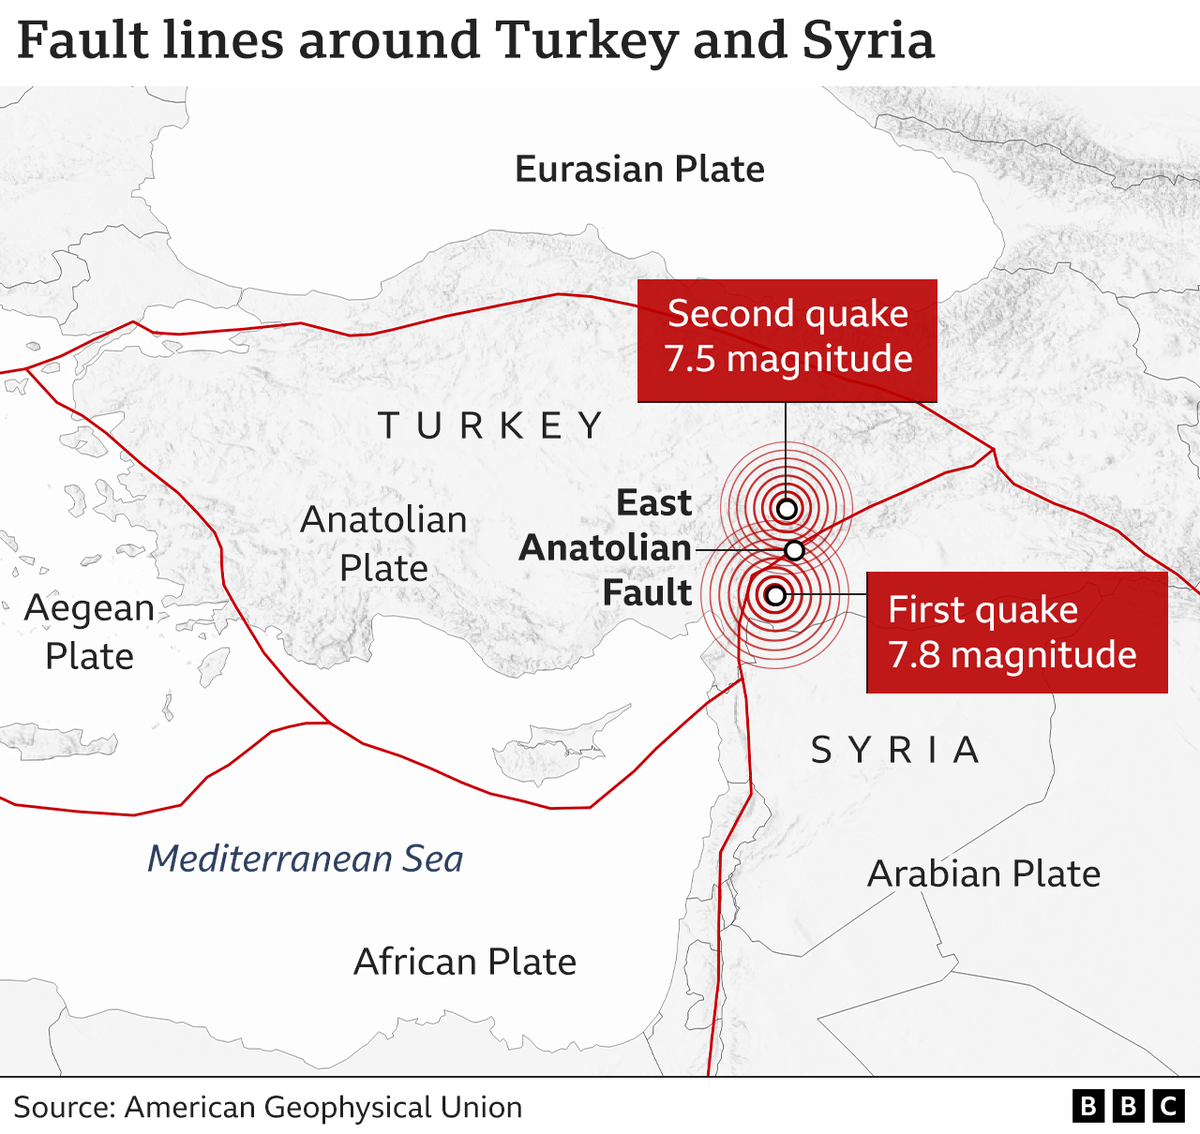


1
43
82
UPDATE: New Sentinel-1 image from today shows the Gulf of #Suez getting busier as more ships are awaiting the clearing of the Canal.

3
25
81


Friend: How often do you think about the Roman Empire?. Me: Proceeds to make a map of all roman roads

4
7
66
Sunny day in France today ☀️ Almost no clouds at all on this Modis image, quite a rare view.

0
6
58
French presidential election results mapped. A very clear urban/rural cleavage.

6
11
68
I annotated some of the new icebergs from the Pine Island Glacier with names of cities or countries which are about the same area. Most of us never had the chance to see some icebergs in real life, their size is sometimes hard to grasp. Download 👉

1
32
63
You really don't need to zoom on 30cm resolution satellite imagery to spot damage in Gaza. New Sentinel-2 image from this morning (10m resolution) shows widespread damage to urban areas and farmlands across the whole Gaza Strip.

2
34
61

Early signs of El Niño visible in sea surface temperature anomaly for March 2023, especially off the coast of Peru and Ecuador

0
12
49
I got tired of always doing the same NO2 maps/animations, so here is something a bit different. India's lockdown caused a drop in NO2 concentrations in cities (about -50%), while coal-fired power plants remain the most polluted spots.

3
15
50

A smoky day in Northern Australia as seen from Himawari-8
2
13
43
The Australian bushfires as seen from the ISS yesterday, a different perspective than nadir satellite images.

1
19
42

First big data journalism piece, and first byline in @BBCNews! We had a look at AIS data of Russian-linked superyachts, and spotted them running away from EU waters to avoid being seized following sanctions.

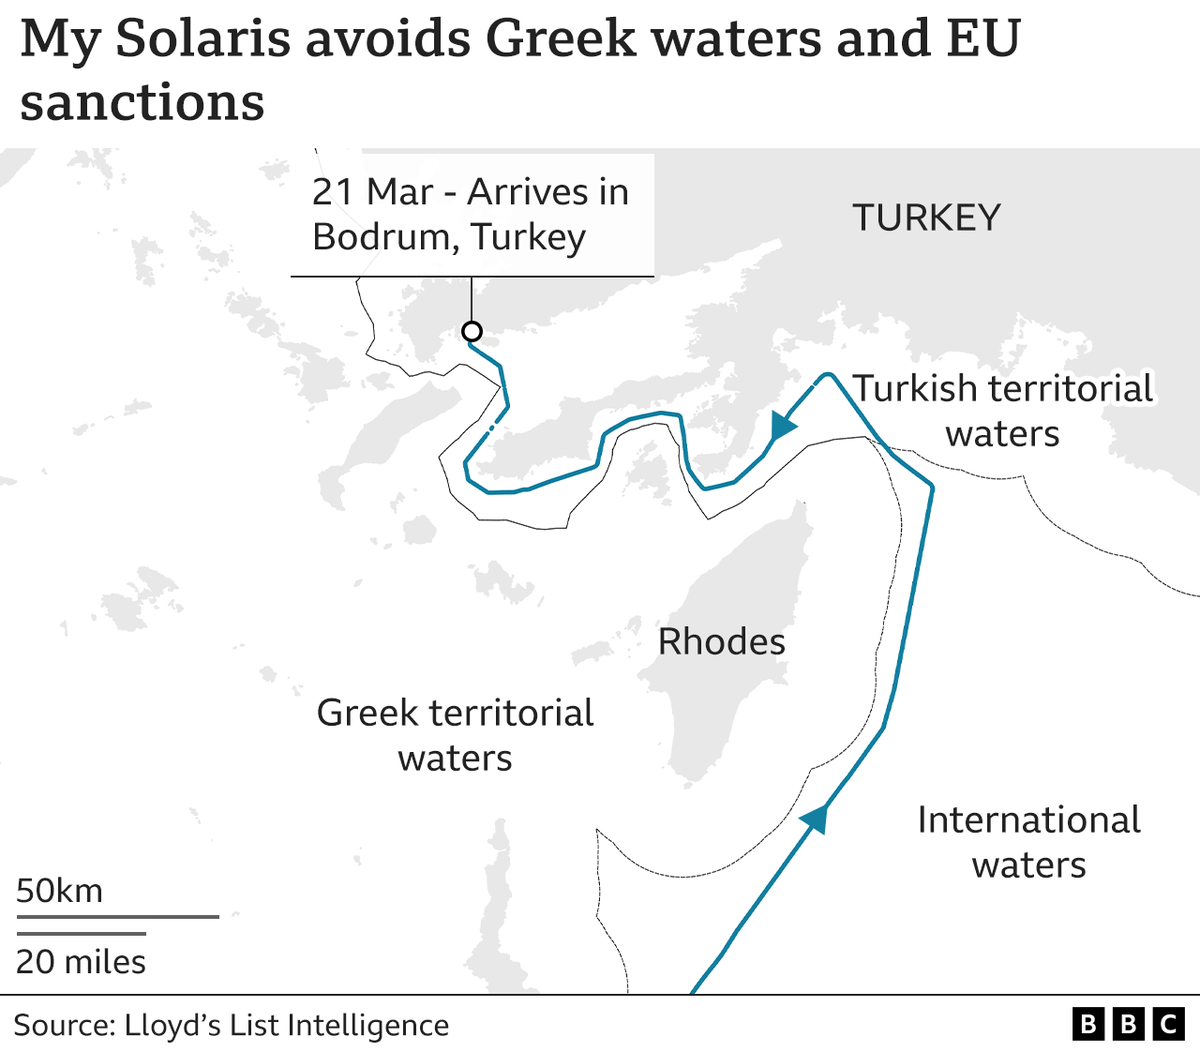
2
10
48
Annotating satellite images is so underrated, it can be very time consuming, but those small details are adding so much information and value to the image!. This is an example of rock-ice avalanches in the Himalayas observed with Sentinel-2.

2
6
40
#30DayMapChallenge Day 7: Navigation. Lighthouse map of the British Isles . Christmas tree edition 🎄
0
2
37
The SO₂ plume from the #HungaTonga volcano travelled more than 7000 km west and is now above Australia. Data from Sentinel-5P satellite.

2
14
33
#30DayMapChallenge - Day 6 - Red. A map of France made only with stop signs (about 220 000). Notice that there is not a single stop sign in the city of Paris, hence the small dark hole.

0
2
31
I heard this story that there was only 1 stop sign in the city of Paris, I got curious and checked, there are actually 14 according to Open Street Map. Still quite interesting!

1
9
33
More than 171 trillion pieces of plastic are estimated to be floating in the world's oceans, and it is now mapped!. If you skimmed the surface of the Mediterranean Sea, over an area of 1 sq km, you would end up with about 10 million pieces of plastic

1
16
33
The world's largest iceberg, A-68A, has travelled more than 1500 km in the past 3 years. Most of which happened during the past year as it escaped sea ice and entered into open waters. It is now heading towards South Georgia Island. Read more 👉 .
0
11
30


The last 2 weeks of rainfall in California mapped for our visual story:

3
6
28


I did promise you would see more satellite images in BBC News graphics!


0
2
28
The path of an eclipse seen from satellite Himawari 8 today
0
18
21
🌋 #Kilauea new lava lake from #Sentinel2 satellite. The infrared hotspot makes it clearly visible and looks a bit like the Eye of Sauron right? 😅
2
8
29

The new A-76 iceberg was the current world's largest iceberg for only 2 weeks! New Sentinel-1 image from May 26 shows it lost two big chunks, and therefore giving back the title to A-23A which is also located in the Weddell Sea.
4
7
25
Analysis of Sentinel-1 radar satellite images by @coreymaps & @JamonVDH reveals damaged areas in Gaza - a lot more damage in the northern part, which Israel ordered to evacuate

1
10
27
Cloud-free satellite images of the whole Iceland are quite rare. I've been on the look-out for one since I first joined @ESA_EO, and 2 weeks ago, conditions finally permitted. Download it 👉
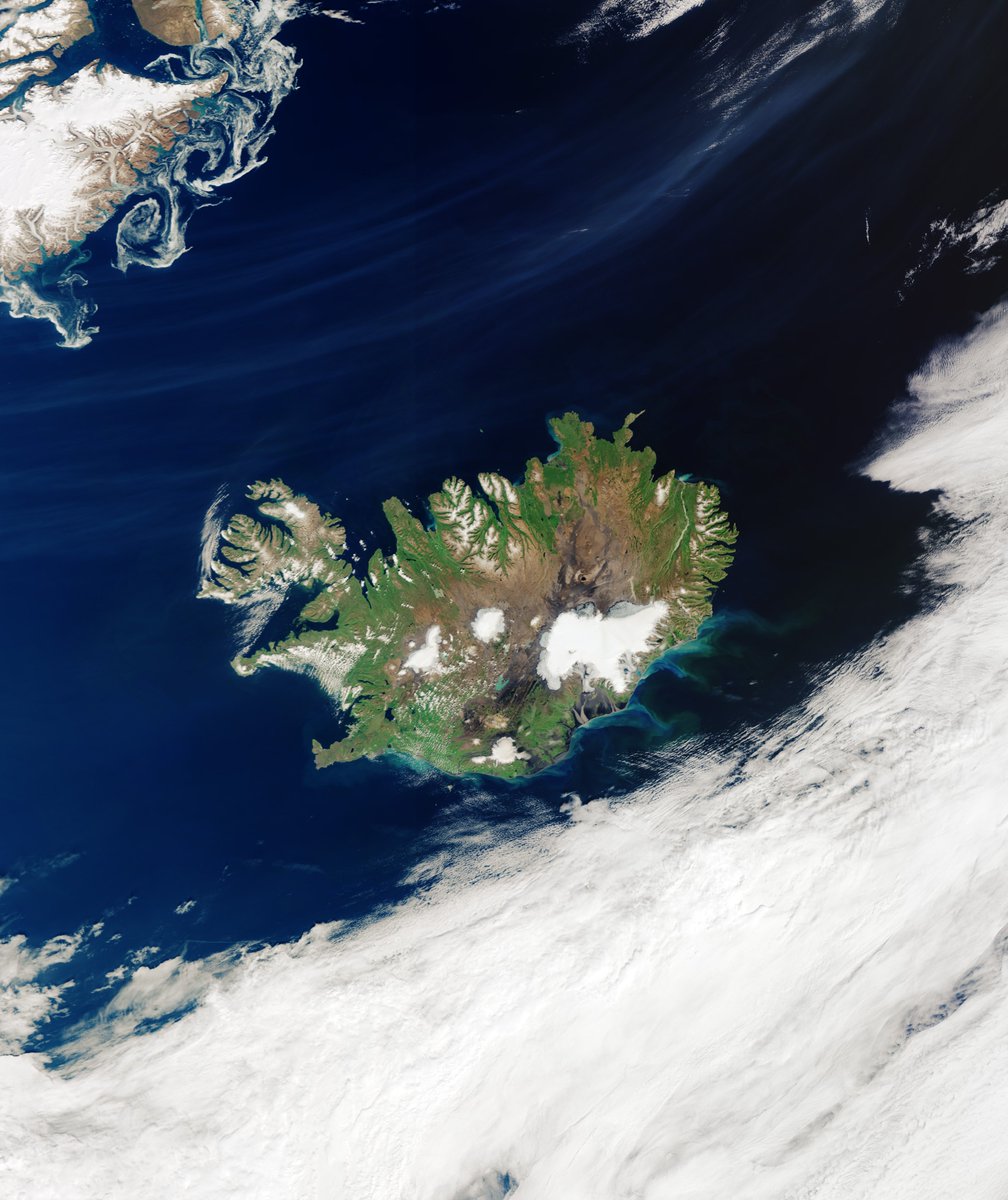
1
4
24
Thrilled to join the @BBCNewsGraphics today as a graphic designer! I'm so excited to learn a ton and contribute with some cool maps, so keep an eye open!.
6
1
26

By examining hundreds of satellite images, we have identified some key areas in the significant build-up of Russian fortifications in Ukraine. Trenches, bunkers, anti-tank ditches, dragon's teeth, we can see it all from space. From @Danict89 and I.
3
10
25
Today was my last day at @ESA_EO. After 3 years of an incredible adventure where I learnt so much, it is time for me to say goodbye to what was a real dream job. I will be starting another dream job next week, I'll give more news once I'm there!.
2
0
26
Where is Russia taking Ukraine's stolen grain? - We used satellite images and tracking data to investigate the theft of Ukraine's grain by Russian forces. Following trucks, trains, and ships, we attempt to uncover where this stolen grain is moved to.
0
7
23
With a bit of tweaking, you can merge Sentinel-3A and 3B orbits to create a larger view. Here is Cyclone #Amphan as seen today over Bangladesh and India.

0
4
23
How did Russia repair most of the Crimean Bridge in less than 2 months? We’ve analysed satellite images from @planet to show the process, from dismantling 4 damaged road spans with crane barges, and installing new sections covered with asphalt.
2
8
22
Come make some cool data visualizations with me at BBC News!. Dataviz designer/reporter role opened today (in Birmingham), happy to answer any questions.


0
7
24
NEW: Antarctic sea-ice hits a new record low, breaking last year’s record and with about 10 more days of melting to go. Words by @BBCAmos and dataviz by @becky_dale, @janatausch and me.
0
12
23
La côte d'Émeraude, Saint-Malo et la Baie du Mont-Saint-Michel 😍

1
4
22

#30DayMapChallenge - Day 17 - Historical. Les 9 pays historiques de #Bretagne qui forment les 9 bandes horizontales du drapeau breton.

0
1
19


The 2021 Sentinel Calendar is out 🎉. This year's theme is megacities, with images of Kinshasa, Lima, Chongqing, Mumbai and more!. Download 👉


0
5
19
Reduce three years of Sentinel-1 data into a single image to highlight all the boats. Split by year to make them colorful. And here you go! Here is the Bay of Naples, but go check other busy port cities such as Gibraltar, Istanbul, Panama . Read more 👉

1
4
18
There is a new #BlackLivesMatter mural, and it is so huge it can be seen from space (~7km in diameter). Sentinel-2 satellite image from July 13, over Black Rock Desert, Nevada.

2
10
19
Yesterday's view of UK and France from space compared to same day last year shows the current drought

0
6
17
New Map🎉 I used @BAS_News data to map the Bathymetry around South Georgia Island. A-68A iceberg most likely hit the shallow sea floor, and lost a piece of about 140 km², the size of the city of Seville. Read our story 👉

2
3
18

Multi-temporal Sentinel-1 image shows flooded areas along the Po River in Northern Italy. Full image & info 👉
0
5
17
The fight for Kyiv is taking place in the suburbs of the city, to the north-west here in Irpin. Yesterday's Sentinel-2 image shows many infrared hotspots, suggesting intense fighting.

1
3
15
New map 🎉 Antarctica ice velocity with data from the NASA MEaSUREs project, which used 10 different satellites such as Envisat, Landsat-8, Radarsat or Sentinel-1 to map the ice motion of the whole continent.

1
5
16
Rome and surroundings as seen from Space. Lago di Bracciano, Lago Albano, Tiber River sediment plume. and of course @ESA_EO office in Frascati!. #Sentinel2 image from December 11.

0
3
14

New animation 🎉 I went a bit back in time to see exactly how the calving event of A-76 iceberg happened. Radar images for the win!
0
3
16
NEW: Water companies released raw sewage into rivers and seas in England for more than 1.75 million hours last year. We mapped it so you can see exactly where the spills occured with this interactive map. Have a try:
0
5
18

Data from the @metoffice revealed the scale of last summer's heatwave. More than half of the UK's weather stations recorded their hottest day ever in 2022, breaking previous records by huge margins. We visualised it with @nassos_ @becky_dale & @janatausch.


1
2
14

0
5
15
Satellite image from yesterday shows the 2 ongoing wildfires in south-west France that have forced over 16,000 people to flee the area.

1
9
13
Our climate is going off the charts, quite literally. We just saw the warmest day ever recorded (global average T), breaking for the first time the 17C line. It was in fact the warmest week, and this July will likely become the warmest month ever.

2
4
16
Satellite view of the Bijagos Archipelago, off the coast of Guinea-Bissau 🇬🇼. 🛰️ Sentinel-2, 4th of January 2021

1
0
16