

Martin Wattenberg
@wattenberg
Followers
18,264
Following
509
Media
84
Statuses
734
Human/AI interaction. Visualization as design, science, art. Professor at Harvard, and part-time at Google's People+AI Research initiative.
Joined July 2008
Don't wanna be here?
Send us removal request.
Explore trending content on Musk Viewer
TEMU
• 453657 Tweets
Afghanistan
• 331307 Tweets
最大5,000円報酬
• 241581 Tweets
روما
• 204815 Tweets
領空侵犯
• 160032 Tweets
Arlington
• 159190 Tweets
Sven
• 130391 Tweets
Delpino
• 62519 Tweets
Abbey Gate
• 35038 Tweets
Scout
• 34019 Tweets
Olmo
• 33890 Tweets
Finale
• 33798 Tweets
Nintendo Direct
• 29811 Tweets
Alex Sandro
• 26583 Tweets
Medina
• 24294 Tweets
Charli
• 24215 Tweets
D-1 TO CHANYEOL SOLO
• 20163 Tweets
伊藤さん
• 17954 Tweets
Nelita
• 14870 Tweets
瑞希誕生日
• 14148 Tweets
Ubisoft
• 14069 Tweets
Beşiktaşlı Oğuzhan
• 11378 Tweets
Lowe
• 10892 Tweets
Christensen
• 10151 Tweets


First day of school! Today I'm starting as a professor at Harvard. My research will center on visualization, human/AI interaction, and how we can use computers to generate insight.
28
14
1K
How does a neural net represent language? See the visualizations and geometry in this PAIR team paper and blog post
9
332
980
Tiny neural networks have a surprisingly rich inner life, and may hold clues to how their larger cousins work. This image: evolution of feature vectors during learning. Full story: (in collaboration with the great interpretability team at
@AnthopicAI
)

11
96
733
PAIR's new "What-If Tool" lets you probe a machine learning model, no extra coding required! Visualize inference, find counterfactuals, see feature importance, try algorithmic fairness criteria. Now in TensorBoard!
@bengiswex
@mahimapushkarna
Jimbo Wilson
7
143
471
Visualize transformer attention!
AttentionViz, created by Catherine Yeh and expanded by Yida Chen, helps you explore transformer self-attention by visualizing query and key vectors in a joint embedding.
Paper:
Website:

5
91
407
Histogram of (mostly) rocks found on a Wellfleet beach. Happy August!

5
44
288
I’m excited to announce that starting in fall 2021 I’ll be a professor of computer science at Harvard (and affiliated with the business school). And yes,
@viegasf
will join me in spring 2022! We’ll also continue to work part-time at Google and on PAIR.

26
9
285
Paths in polygonal billiards: image made after reading work of Iranian-American mathematician (and Fields medalist) Maryam Mirzakhani.

8
99
252
Thinking about grad school next year? Interested in visualization, human/AI interaction, or computational art? Consider Harvard!
@viegasf
and I are building up our lab and will be looking for students. Our DMs are open.

6
47
237
Does this
@WSJGraphics
chart downplay US concern over Russian hacking? Here's a redesign for comparison.

7
153
187
This simple math model is so surprising I wrote code to verify for myself (pic).
http://t.co/X36v7otU0B
http://t.co/Z20uNDXPd5

10
96
173
When
@viegasf
and I designed our wind map, we scaled the brightness by the top windspeed in the data. We also only plot wind over land.
So when a hurricane is heading to landfall, the map goes ominously, unreadably dark. Technical bug, emotional feature.

5
52
179
Delighted to announce PAIR: People + AI Research initiative. Let's add HCI and design to classic machine learning!

0
62
146
Visualization doesn't add insight, it multiplies. If you know nothing about your data to start with, visualization won't help.
13
94
148
Did your neural net say "zebra" because of pixel (17, 153)? Or because of the stripes?
TCAV interprets neural nets with high-level concepts, not low-level features. See and cc
@_beenkim
@jmgilmer
@Carryveggies
@bengiswex
@viegasf

1
58
143
I've been seeing unusual "tornado plot" diagrams floating around, and wrote a tiny interactive tool to help myself understand them.
Draw your own x-y graph, see what it turns into with a tornado plot! (Spoiler: it's probably loopy.)

6
37
142
Looking for a postdoc position in data visualization, human-centered machine learning, or both? Consider joining our lab at Harvard! Here’s the official announcement:

1
31
136
It's alive! Play against the artwork and see a vintage chess AI think.

6
71
118
Play with a tiny transparent neural net: (illuminating work from
@dsmilkov
and
@shancarter
)

2
76
114
Thinking about grad school next year? Interested in visualization, machine learning interpretability, or human/AI interaction? Consider Harvard.
@viegasf
and I are continuing to build our lab!

1
20
114
UMAP is a real advance in visualizing high dimensional data. But how should we read it? And when should we use it? Take a look at this interactive essay by
@_coenen
and
@adamrpearce
!
2
24
105
If anyone questions the role of animation in visualizations, show them this masterpiece from the NYT.
0
37
93
Machine learning on the web takes the next step... Awesome improvements to deeplearn.js - now known as TensorFlow.js. Can't wait to see what people do with this!
3
44
91
Square-by-square difficulty of today's NYT crossword, as rated by a multigenerational group.
http://t.co/EGbKSDnnlP

3
91
93
Paramount's 1927 map of California: where to shoot movies set around the world.
http://t.co/fnhW0wIA
via
@jkriss
@timtrueman
4
158
92

Our group at Google is looking for a machine learning researcher. Key areas: interpretability, visualization, HCI.
3
46
87
Wonderful essay on science and art! Jane Richardson describes how woodcuts, vases, and origami influenced her research. Now I know where those "ribbon drawings" of proteins come from.

2
33
86
This beautiful project is the visualization equivalent of seeing a perfectly restored Ford Model T driving on the highway.

I recreated Byrne's 1847 edition of Euclid's Elements including interactive diagrams, cross references, and a new poster of all the original illustrations: Plus an in-depth blog post on how it was made:


62
1K
3K
1
23
83
Can we predict earthquake aftershock locations with AI? Will machine learning and science go together like chocolate and peanut butter?
In Nature today:
Or see:
(collaboration with Phoebe DeVries,
@brendanjmeade
, and
@viegasf
)
0
19
78
Open-source machine learning from Google! Our group contributed visualizations :)

1
49
77
Explore your high-dimensional data with a new open-source tool!
(I just learned "clever" is quite close to "lazy")

4
38
76
If you like visual math, I recommend this lovely thread:
e.g., this proof that 1 + 2 + ... + (n-1) = (n choose 2)
1
33
74
Fractions are beautiful! Look for a rainbow of patterns in repeating decimals.
http://t.co/JqD775MVkH

2
52
74

Highly recommend Code as Creative Medium by
@golan
and
@tegabrain
. It’s a genuinely important book for anyone interested in teaching or learning about algorithms and art. A wonderful mix of theory, practice, and inspiration!

3
14
66
Simple, meditative piece from 1997, updated to run in today's browsers:
http://t.co/88k9NGjRSe
7
80
65
.
@albertocairo
@andrewvandam
A direct comparison of segments in that graph helps show the pattern in unemployment change.

3
30
62
Designing with AI requires a big change in mindset—in my opinion, just as big as when graphical user interfaces were introduced.
I'm delighted to announce the People + AI Guidebook, which lays out recommendations for designing human-first AI products.
0
17
62
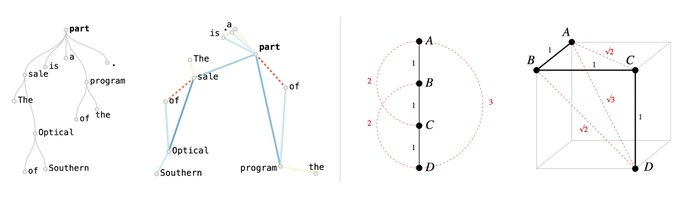
The blog at explores the shape of these representations, with math and visualization. A mysterious “squared distance” effect they found turns out to be surprisingly natural!
2
14
57
Some context: Recently
@johnhewtt
and
@chrmanning
discovered certain neural networks (e.g., BERT) build internal geometric representations of syntax trees. It’s beautiful: the full tree is actually embedded in a high-dimensional vector space.
1
17
59
A cheerful "hello" from the new GPU-accelerated javascript ML library!


Hello world :)
We will be posting updates and new demos for
#deeplearnjs
here.
Send us demos for a chance to be featured on the homepage!
0
17
61
0
20
59
This generative art walkthrough is so good!
The visuals are a treat, the explanations clear and generous.
(Art and essay by
@tylerxhobbs
. h/t
@soficrespo91
)

1
10
60
We gave a Rorschach test to four artificial intelligences. Here's what we found...

2
63
47
I'm glad people are enjoying this visualization that is powered by free US government climate data :)


1
15
47
Cute (in every sense) simulation of neural nets evolving:
http://t.co/RwdAUcf5eA
(via
@karpathy
)
http://t.co/RfXMlwEfWH

1
36
46
Silver lining of remote meetings: saying something stupid, instantly regretting it, then hearing the response "You're on mute"
4
3
46
I marched in DC today. The crowd held energy, power, and hope. This is what "strength in numbers" means!

2
3
45

What does a neural net see when it looks at an Escher print?
Explore illusions in an automatic depth perception system:
From
@EllenJiang2
,
@emilyrreif
and
@_beenkim

1
6
42
Having this platform for clear, dynamic explanations is incredibly valuable. May all journals look like this one day!

Machine Learning Research Should Be Clear, Dynamic and Vivid.
Distill Is Here to Help.

4
128
170
0
25
39


Look at all the ways people draw water in maps! This is just one piece from a beautiful set of tweets spanning design, history, coding, and math—I recommend the whole thread, and the set of notebooks at


Though they aren’t the only way to draw water – water appears as *so many* different kinds of graphics in maps of the past
1
5
29
2
6
39
What does it really mean to design for human/AI collaboration? How can doctors and ML work together effectively? If you're at CHI, go to this talk for some answers! (And if you're not, the paper's online.)

How can human-centered tools make AI more useful to doctors? I'll be presenting on our
#chi2019
paper tomorrow, which won a best paper honorable mention!
Human-Centered Tools for Coping with Imperfect Algorithms during Medical Decision-making
Monday 11am

14
117
467
1
10
37
Great thread. A good visualization doesn't just transmit data, it also helps people mentally compute with that data. Designers should consider both aspects.
This paper sheds light on how different visual encodings affect one common computation people do, namely averaging.

IN PRESS: Perceptual proxies for extracting averages in data visualizations
by Lei Yuan,
@sharoz
, &
@SteveFranconeri
to appear in Psychonomic Bulletin and Review
This work asks how we compare set averages in graphs. 1/
#dataviz
#visionscience
#ieeevis
5
20
65
0
2
35
Amazing speakers! Watch the PAIR Symposium (People + AI Research) livestream Tuesday, Sept. 26, starting 9:15am ET.

1
9
33
Redesign thread: This chart in today's
@nytmag
is attractive and interesting, but the design gives outer rings way more visual weight than inner ones--and really, outer vs. inner shouldn't matter. I started wondering how much difference this actually makes.

3
2
33
How not to color a globe! Did the designer secretly wish certain countries would fall into the ocean?

4
0
34
A periodic table of... elements! The Big Picture group plays with a classic visualization:
http://t.co/JfpOtKDJfX
4
39
32
Really feeling that Wasserstein metric as I shovel my driveway
1
0
34
A geometrical construction so appealing I had to try it myself, and made these images.


0
10
33
MT
@svenaxel_
Color use in 88,000 oil paintings since 1800. Seems blue is the new orange. Via
@cocteau
http://t.co/yySCz0sERj

6
17
30
After reading this article, I wonder... if the 1918 flu had left a bigger cultural footprint, would the world have been more attuned to the risks of a pandemic?

The 1918 Spanish Flu wreaked havoc on nearly every country on Earth.
So why didn't more artists respond to it in their work?


7
32
83
1
5
31
Wow, such a beautiful way to see (and think about) meteor showers!

0
13
30
Bach to future! Compose your own music, with the help of the AI on today's home page. Great collaboration with the Magenta, Doodle and TensorFlow.js teams. Congrats to all involved!
1
5
31
What are good chart colors to represent past, present, and future? Not looking to "gray out" a prediction, but just represent time.
15
3
29
Excellent interview with viegasf@, who is always inspiring!

2
3
31
Some images near the radius of convergence of 1 + z + z^2 + z^3 + ...

1
5
31
I wish we talked about global warming in millidegrees. A mere 1.1 degree increase is easy to ignore. A whopping 1,100 millidegrees might feel more like a crisis.
3
1
30
A map of 9,455,582 services performed by Planned Parenthood in a single year.

1
16
26
Epistolary visualization:
http://t.co/WJXyqbFOGY
Delightful new project from
@stefpos
and
@giorgialupi
http://t.co/C2dpWjb6Jt

0
22
29
One of many fascinating insights from the new baby name data that came out today. Read more at !

Alexa is the
#1
fastest-falling baby name of the year. Apparently parents don't like the idea of everybody telling their daughter what to do.

0
5
9
0
10
27
Toasters have blinking lights, cars have speedometers. Should chatbots have dashboards too?
A speculative essay: The System Model and the User Model: Exploring AI Dashboard Design

1
4
24
Automatic visualizations (and verbalizations!) of data. New project from our group, with Google Sheets.
1
9
27
Creativity is by turns mysterious, suspenseful, and dazzling - and so is
@zachlieberman
's story of sketching in code

1
6
26
Historic creative visualizations, via Princeton. The weather maps are a treat.
http://t.co/ggACUfV8Qd
http://t.co/iymlYb3nLw

0
28
26
The visualizations on this page really are amazing! (Another beautiful link from
@infowetrust
, whose feed is full of gems like these)

from Walter Houghton's 1880 political masterpiece
👉see all of his amazing information graphics, just published at

0
5
16
1
5
25
Language models have some beautiful spiral plots reflecting positional patterns. And a vision model has heads that arrange images according to brightness and hues. But there’s a lot more to find! What else can you see?

1
5
24
"A Halloween costume for an introvert"
(My prompt; image generated in response by
@midjourney
AI)

1
5
24
@EllenJiang2
@emilyrreif
@_beenkim
And what happens when you apply this idea to other artworks across history?
Read more here:
And try it yourself with this interactive visualization:
0
3
25
I'm teaching with
@OpenProcessing
for the first time, and am completely impressed with how polished and friendly the system is. Every detail is on point. Last class a student spontaneously said, "OpenProcessing is just so great." I agree!
1
1
24
Visualizing the rhymes in Hamilton: a delight for eye, ear, and brain.
0
17
22
A thread on using
#midjourney
to create illustrations for a talk.
Very different from art / exploration / whimsy, and an interesting example of human-AI interaction!
3
1
21
Sometimes the simplest visualizations are the most magical. (via
@safreitas_c
)

Great visualisation of how convex and concave lenses bring light rays to focus and diverge.
#Science
#Physics
#ScienceFacts
61
2K
8K
0
3
22
A pair of launches from Google PAIR!
Essays on participatory machine learning
AI Explorables: visualizations of topics in machine learning
0
5
22
Key point in 9th game of world chess championship, as seen by visualization from

2
10
22
You can even see what the neural net thinks as you write yourself! Fascinating interactive article from my Google Brain colleagues.

See what a neural network is thinking as it models human handwriting!
1
42
65
0
5
22
Are you a visual designer interested in machine intelligence and UX? We have an opening!
1
13
19
Wow: some of these "image-to-image translation" results from Isola et al. are almost better than reality.

0
8
22
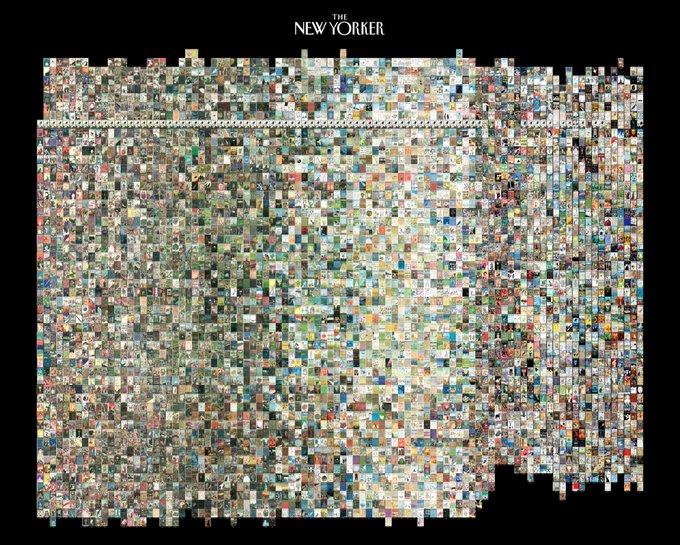
Wow, this visualization of New Yorker covers clearly reflects the four Manhattan seasons: spring, beach, autumn, and indoors.

Every cover of The New Yorker, from 1925 to 2018.
The horizontal line/artifact comes from the way that they re-run their first cover (and more recently, a variant of it) each year on their anniversary.
Much better up close:
4
87
349
2
6
21
Chess ray tables make surprisingly pleasant test images.


2
7
21
A shiny new name grapher!
Full description here:
For visualization aficionados: compare the line vs. stacked graph views. Such a contrast, and useful in different ways.


0
3
20
New results on multilingual neural translation, with hints of a language-independent "interlingua"

1
14
19
I also made a bar chart, for comparison. It's definitely more precise. But as I made it, I realized that what I really wanted to know was, what age do people think it's OK to have a phone? So I made the cumulative chart on the right.

2
3
18
Questions about visualization and machine learning are welcome!
@viegasf
and I will be part of this Reddit AMA.

Got machine learning questions for the Google Brain team? Join our first
#RedditAMA
tomorrow, August 11 at 10am PT -
2
129
179
0
7
19