
Taylor Baldwin
@taylorbaldwin
Followers
4,330
Following
1,297
Media
1,821
Statuses
15,957
co-founder @JamsocketHQ / @drifting_corp • YC W22 web graphics • browsertech • data vis • classical piano • ex @datadoghq @uber @nytimes r&d
New York, NY
Joined February 2009
Don't wanna be here?
Send us removal request.
Explore trending content on Musk Viewer
#BUS_KnockKnockKnock_Korat
• 177812 Tweets
#UFC307
• 142680 Tweets
Watch Sant RampalJi YouTube
• 130762 Tweets
Tennessee
• 114600 Tweets
Dodgers
• 112274 Tweets
Miami
• 88066 Tweets
Pereira
• 83005 Tweets
ドジャース
• 68815 Tweets
Khalil
• 54463 Tweets
Arkansas
• 39206 Tweets
Aldo
• 33921 Tweets
Ifigenia Martínez
• 30631 Tweets
Pennington
• 23256 Tweets
京都大賞典
• 23058 Tweets
Poatan
• 14637 Tweets
#PressConMGSongKhla25xENGLOT
• 11943 Tweets
Cam Ward
• 10462 Tweets
Canes
• 10220 Tweets
Last Seen Profiles


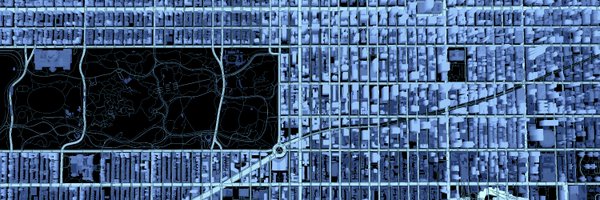
Spent the last few weeks parsing NYC's massive 2017 lidar dataset (almost 1TB of data) and segmenting them by building. Now you can select any of NYC's more than 1M buildings and see its point cloud.
#webgpu
23
138
1K
Excited to finally release this 3D interactive
#DataVisualization
that renders all 47K buildings in Manhattan.
Best on desktop Chrome! 😬
#creativecoding
#dataviz
#nyc


22
344
1K
Finally releasing the Citi Bike
#dataviz
I've been working on!
Only works on desktop right now 😬
19
224
605
Finally updated my sketches gallery to include work from the last 2 years. Many are parameterized, animated, and interactive, so the screenshots don't always do them justice.
#generative
#creativecoding
#webgl
#javascript


17
89
447
Figured I'd go ahead and release this little music visualization I've been working on for a bit.
Best on desktop Chrome 😬
🎵Oh, and the video has sound! 🎵
#musicvisualization
#creativecoding
13
64
322
Today it's LiDAR data!
This little patch of midtown has 17M points.
#webgl
#lidar
#pointcloud
#datavis
#maps
#javascript
11
52
223

Short video from a weekend project that renders all 1M+ buildings (36M triangles) in NYC using WebGPU.
7
21
205
Alright, now I've got every building in New York in here. That's more than 1M buildings, 35M triangles.
Next step: convert base map lat/longs to the building coord system, EPSG:2263 (or vice versa).
Then, prioritized streaming based on camera position.
10
9
183
Now for the whole city
~800K buildings
~27M triangles
rendered in Chrome at 60 FPS (on an RTX 2070 😬)
#creativecoding
#maps
#webgl
#javascript
7
32
157
Another rendering, this time applying some outlines with a post-processing pass that uses the depth buffer to detect edges.
1
6
142
Jesus this is incredible

NEW!! 🎉 Super happy to share a new
#dataviz
project that visualizes how Planet's satellites creates a full image of Earth's landmass in ONE day! 🌍
See how the Earth is slowly build up from each of the whopping 600,000 images taken in a single day 🛰️
96
2K
5K
2
7
138
Spent a few weeks working on a Rust+wgpu tool for generating per-vertex ambient occlusion values. But I'm taking a break tonight to try out some new rendering techniques. Starting here with some edge detection in the fragment shader.
#webgpu
3
7
133
Ooo - something I built is open to the public

Today we’re releasing a new bike trip data tool that shows where and when cyclists are most active in our cities to help establish safer and better bike infrastructure.
The data is available for SF, DC and Paris, with more cities coming in the future.
11
36
176
10
15
129
Testing out a new camera animation I implemented this evening, stopping occasionally to look at a couple buildings' LiDAR scans.
#webgpu
5
9
128


5
5
117
3
6
118
3
9
108
GPU-based culling now with
#webgpu
compute shaders. Doesn't look that different from before, but it renders much more smoothly. This is checking 52k bounding boxes on each frame.
Need to do some more profiling to see exactly where the number of bounding boxes (and draw calls)
3
6
100
Look! It's a thing I made! And it's in a museum! Up at
@MuseumofCityNY
through Oct 6!
#datavisualization
#DataViz
#cyclinginnyc

11
10
100

Spent the day working on a little helper to add DOM-based text annotations to WebGL-based visualizations.
Still need to do some work to get the labels to give each other space, but I've found that constant animation makes them all separate eventually, so maybe it's okay? 🤷♂️
3
3
92
Fixed the z-fighting in the base map and now using WebGPU's Render Bundles.
4
5
85

Why not make the rendering take even longer by using lots of little dots instead of lines?
#creativecoding
#generativeart
#codeart
3
6
78
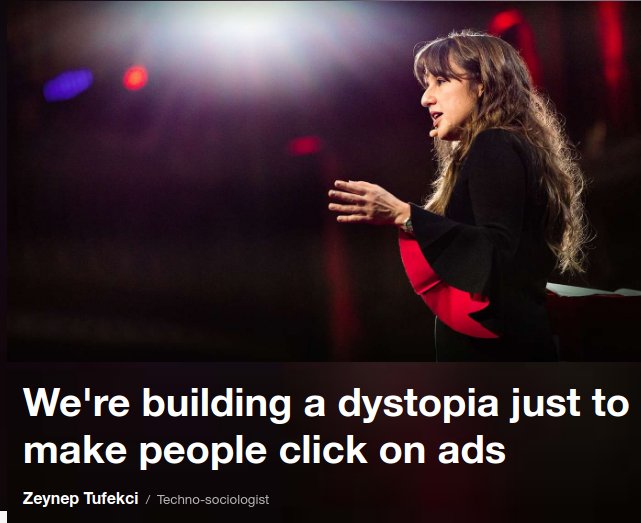
.
@zeynep
is one of my favorite thinkers on the topics of AI and authoritarianism. Her insight here is 💯

New: My talk on why I fear ad-financed digital economy could lead us to surveillance authoritarianism, and how.
75
2K
3K
0
13
79
Been learning 3D maths, and I've found 2D canvas to be a great place to practice what I'm learning.
3
6
75
Now bringing the culling work back into the main project. Here's culling with the entire 1M building NYC dataset.
Using drawIndirect() already, so next step: have compute shaders do the culling and write all the draw params to a buffer before the render pass.
#webgpu
2
8
72
NEWS! So I left my job last week, and, well, this week I joined forces with
@paulgb
to cofound Drifting in Space! 🚀🚀🚀

We’re excited to announce that Drifting in Space has raised funding from
@ycombinator
!
We’ll use this account to talk about what we (
@paulgb
and
@taylorbaldwin
) are building, like this post on session-lived backends and why they matter.
7
5
49
15
4
71
4
15
70


6
7
64
Finally got the algorithm working in 3D. It’s a bit slow, uses far fewer particles, and a 128x128x128 cube for the simulation.
#webgl
#javascript
#code
#generativeart
#generative
#creativecoding
3
7
62
Combining depth-based edge detection with a new normals-based approach in a custom shader. The faces of each building are much more visible now. The plan is to tweak this a bit more over the next few days, then turn to some new experiments with adding labels.


2
3
62

2
2
60
5
5
58
4
6
58


3
3
55
Plotted some new pieces for my bedroom.
#generativeart
#proceduralart
#creativecoding
#codeart
#plotterart

3
2
56


Well, it looks like my 5-week funemployment has come to an end. Excited to be joining the Uber data visualization team tomorrow!
4
0
54
Sketching tonight and accidentally getting some really pleasant scribbles.
#generativeart
#codeart
#creativecoding


2
2
51
Playing with Citi Bike data again. Using the color wheel to show average direction of trips from each station over the course of a weekday.
#datavisualization
#deckgl
#javascript
#creativecoding
2
8
51
Been awhile since I've had anything available on primary, but today I've got some new loops up on
#hicetnunc
#nft
#generativeart
#creativecoding
#codeart
#hicetnunc2000
@onhicetnunc


2
7
48
2010-2019 in review:
- moved to NYC
- came out
- learned to code
- pianist -> engineer
- traveled world with the bf
- started creating art
3
0
52
Doing some quick sketches tonight. Maybe I'll stumble on something interesting 🤷🏼♂️
#creativecoding
#generative


2
1
49
Some compelling data vis here on Friday’s NYT cover


0
12
49
Reworked this old project with
#regl
tonight. Thanks,
@MikolaLysenko
et al!
#creativecoding
#generativeart
#webgl
2
10
47
Spent a lot of time over the past few weeks working on this demo. Pretty excited about the potential.
When visualizing massive datasets, you hit the limits of WebGL. We built a way to seamlessly migrate a local visualization to a more powerful remote GPU, without leaving the browser.
Preview the docs at , and reach out if you have a use case.
19
64
684
3
5
45
Why is this so satisfying to watch? Feels like dumping a bunch of legos on the floor.
1
11
44
Playing with
@wwwtyro
's wonderful geo-ambient-occlusion package tonight and getting some nice shadows.
#javascript
#regl
#webgl
#creativecoding
2
6
45
More culling progress. This demo uses 300 bins and cpu-based culling. As the camera moves around, you can see which parts are actually getting rendered in the inset map in the bottom right.
#webgpu
2
1
45
I came out 8 years ago today, and I feel incredibly lucky to have done so at a place and a time that made it as easy as it was. I never thought I’d have the life I have today.
0
0
45
Starting a new GPU sim exploration. Just getting the particle state updates set up on the GPU tonight.
1
1
44
First pass at porting Fracta to WebGL. Still needs some polish.
#generativeart
#creativecoding
#codeart
2
4
44
Realizing I'll probably need to be smarter about how I'm rendering all 1M buildings in NYC. So this is the beginning of some tests I'm doing on culling.
#webgpu
2
3
43
@kmelkhat
The Savoir office where Emily introduced the French advertising industry to Instagram
3
0
42
Just started playing with some SF taxi trajectory data. The traces are relatively low granularity, so there are a lot of long straight lines. But when you layer all the trajectories on top of each other, you get a pretty cool look.

2
5
43
I'm really into this one. Was inspired by some of
@mattdesl
's work and came up with this version that looks kinda hand-drawn.
#creativecoding
#generative
#javascript
3
14
43
Well look at that! One of my artworks is featured in this piece by
@stephenfoley
in the Financial Times!
#generativeart
#nftart
#nfts
#hicetnuncNFT

7
3
41
Alright, this one literally took all day. Need to port this style to webgl finally. These rendering times are killing me.
#creativecoding
#generativeart
#codeart
3
2
40
Doing some more sketching tonight. Experimenting with blobby shapes and gradients.
Some favorites so far:
#creativecoding
#generative
#javascript


4
3
41
I haven't really released any of my piano improvisations before, but last night's seemed to pair well with some of my recent sketches. Here's a short clip:
🎶 Sound on! 🎶
Full version:
#creativecoding
#generativeart
#javascript
#webgl
#piano
5
7
41


These render much faster on my new m1 max 😍
#generativeart
#generative
#creativecoding
#codeart
#webgl

3
3
40
A bit of personal news: today is my last day at
@datadoghq
. I've loved working on data vis with these folks for the past year and a half, and while I am sad to say goodbye, I'm excited about what's coming next. Will be sharing more very soon!
4
0
39
Back to the footprints experiment, but now with buildings.
1
3
38
Code is open, by the way!

2
1
37
Spent the evening porting one of my sketches over to my personal site. Why did this take so long?
5
0
37
Working on an interactive visualization that combines some of the features of my previous NYC projects. This one uses WebGPU with a more detailed base map, covering more area, and hopefully with some live transit data.

4
2
37
The boyfriend surprised me with a night at the 1960s-themed TWA Hotel at JFK. 😍


1
0
37
Another music viz sketch! Another Bon Iver track! 🎶🎵
Remember to turn on your sound!
#webgl
#creativecoding
2
9
35

Back on the citibike viz again. Now filtering trips by origination using a mouse. Working on some transitions.
#webgl
#datavisualisation
3
8
36
So stoked we got this demo working. Pixel-streaming Blender running in the cloud.
Particularly excited about what's possible by having more graphics-intensive components of a web application pixel-streamed into the browser with other parts of the UI rendered clientside in DOM.
New demo: running Blender on a remote server and serving it into a browser over WebRTC. This is our first demo using server-side GPUs.
11
31
389
3
1
36

We did it


I want to write a bot that correctly answers super difficult questions, but misspells everything and insists it's a mouse.
0
1
3
1
5
35
1
2
34

Trying to visualize harmony/tonality by blending colors representing the audio's predominant pitch classes. It's, uh, going just okay.
(Video has sound 🎵)
#creativecoding
#musictheory
#javascript
5
1
32
Every building in Manhattan rendered in the browser. 10M vertices. My computer is melting. 😳
#creativecoding
#datavis
3
8
33
Practicing my 3D maths by slicing and dicing some meshes tonight.
2
1
32
Starting to work on new stuff in tonight's Sunday Sketches. This stuff inspired by the graphical scores of Robert Moran.


1
1
31
Finally doing physics calculations on the GPU!
Please don't ruin this video with compression, Twitter. 🙏🏻
#webgl
#creativecoding
4
5
30
Sneak peak at a viz I'm working on that shows all 100k citibike trips from a busy weekend last September
3
0
31
NYTimes, CNN, & Politico barred from White House press briefing.
Time and the AP had the correct response.

0
8
30
Some favorites from a series I started working on last night.
#generativeart
#codeart
#creativecoding


2
2
30