

Sam Brandt
@sambrandt99
Followers
2,609
Following
318
Media
3,634
Statuses
6,199
Meteorologist | M.S. (2024) and B.S. (2022) in Meteorology and Atmospheric Science @penn_state | @StormChaseTeam President ‘20-21
Joined September 2012
Don't wanna be here?
Send us removal request.
Explore trending content on Musk Viewer
#TrappingxLingOrm
• 178559 Tweets
LINGORM WRITTEN IN THE STAR
• 162319 Tweets
Lamar
• 108646 Tweets
Ravens
• 90534 Tweets
#JAEMINxGUCCI
• 75930 Tweets
#GucciCulturalMonth
• 66583 Tweets
#IRIAMメンテ中のフォロー祭り
• 64284 Tweets
期日前投票
• 56887 Tweets
TEAM McKOL MAGPASIKAT2024
• 40217 Tweets
Chargers
• 36014 Tweets
Godwin
• 29850 Tweets
Francella
• 26620 Tweets
Derrick Henry
• 19824 Tweets
Come to Life
• 17777 Tweets
スヤスヤ教
• 15263 Tweets
साक्षी मलिक
• 12461 Tweets
ルックバック
• 11840 Tweets
श्री अमित शाह
• 11568 Tweets


Pinned Tweet

Once again thank you to
@YASC_online
for letting me talk about vorticity! I'm really proud of how the presentation went, and you can watch the recording here:

2
5
34

For context, the cargo ship that collided with the Francis Scott Key Bridge had a kinetic energy equivalent to a supersonic Toyota RAV4


57
218
2K
3D interactive hodograph. Made in Python using matplotlib
41
123
720
What if I told you this was Central Pennsylvania
#Aurora
📍Penn's View Outlook, Centre County PA

9
48
524
Not all velocity couplets on Doppler Radar mean the same thing. This infographic that I made illustrates the importance of a velocity couplet's orientation on its physical meaning.

10
118
525
Wait she might have a point


Yes they can control the weather.
It’s ridiculous for anyone to lie and say it can’t be done.
25K
7K
42K
12
69
515
Beyond just being a fantastic image, it illustrates the process by which mid-level rotation arises in supercells from the tilting of initially horizontal streamwise vorticity quite well


Yeah, so remember when I said this was the most stunning storm I had ever chased? Yeah, about that...
65
387
3K
3
79
476
Size comparison of ongoing supercells in Kansas and Virginia

17
44
461

A factor that is contributing to Milton's intense wind speeds is its relatively small size. In a smaller storm, the pressure falls occur over smaller distances, leading to larger pressure gradients. I have derived a simplified mathematical model to describe this effect:


9
49
358
Apparent tornado just passed *really* close to the Norman mesonet station. A drop in pressure and spike in wind speed were measured

2
58
347
Insane video. Looks like the heat of the explosion briefly overcame the tornado’s pressure-induced adiabatic cooling and evaporated the funnel cloud

Tennessee tornado 2023. Please be safe.
Friend from my wrestling academy captured this insane video in Madison. Please be safe.
140
1K
4K
7
59
326
Tornadogenesis conceptual diagram with a focus on vorticity. Made in PowerPoint and Photoshop


7
51
315

Trying something new for tomorrow; what kind of storm behavior to expect given the forecasted environment


9
45
299
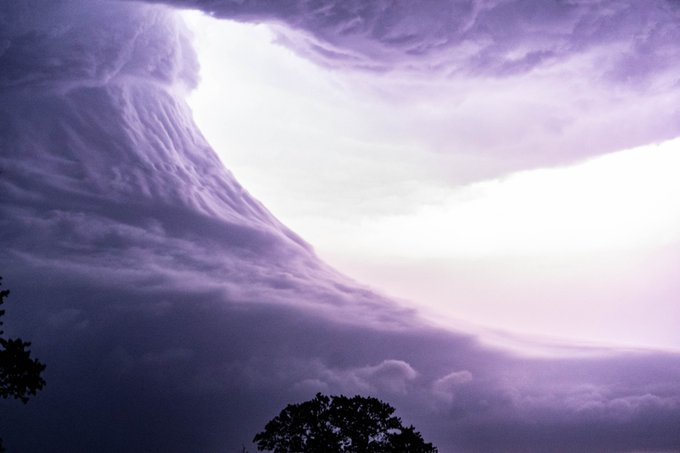
A lot of interesting meteorology in this picture


6
56
266
For fun, I've estimated the mass of evacuated air required to support this simulated Hurricane's insanely low pressures. I get a figure of 1.3*10^14 kg of air. For context, if that mass was in the form of liquid water, it would fill 25% of Lake Erie.


18
41
277
This timelapse is a great illustration of supercell inflow. Easy to see why there wasn't really any strong near-surface rotation; a shallow slant angle of 38 degrees indicates quite gradual tilting of streamwise vorticity.


Watch this amazing hyper-lapse video of a supercell updraft as it slams into downtown OKC!
#okwx
@KOCOMichael
@NWSNorman
@KOCOdamonlane
@MikeMorganKFOR
6
109
590
3
35
251

Discussion about what kind of behavior to expect should storms develop in central Oklahoma’s volatile environment tomorrow evening


8
51
227
A good scientist understands their field.
A great scientist understands the limits of their field.
4
29
227

One thing I really liked about this storm was the visually evident spiral trajectories up and around the mesocyclone. The slope of those trajectories relates the vertical and tangential velocities, providing a great visual of supercell dynamics


2
26
211
Imagine having realtime satellite, radar, hodographs, CAPE, and CIN all on one map to help out with your mesoanalysis. Now visit my GitHub so you don’t have to imagine it anymore:

10
28
211
About as clear an example as you’re gonna find of a supercell ingesting baroclinically-generated streamwise vorticity along an outflow boundary

1
24
193
A topic of discussion in the severe wx community that has gained a lot of notoriety in recent years is the unreasonable efficiency with which supercell/squall line mergers produce tornadoes. I have created a conceptual diagram to illustrate why this is likely the case:

6
22
178
These photos were taken 3 hours and 45 minutes apart from each other. What a day in west PA


0
19
177

Now that an outflow boundary has moved south of KSJT, I can show you direct observations of this process in action. The trick with these interactions is to have an OFB strong enough to enhance the shear, yet weak enough to preserve near-surface based CAPE so a storm can use it


Mesoscale dynamics on display N of San Angelo. Supercell tapping into baroclinic LL shear behind an OFB to the south (note how the shear is ⊥ to the boundary). Also note extra propagation of the storm off the mean wind due to its large size, increasing streamwise % of its inflow


1
7
44
2
35
169
The Rocky Mountains can significantly impact the evolution of the long wave trough that is set to kick start cyclogenesis in the Eastern US in the days leading up to Christmas. A neat connection between mesoscale and synoptic dynamics


4
27
169
I came across some cool fluid dynamics on my walk today: silt revealing a beautiful transition from laminar to turbulent flow! This was likely caused by the puddle suddenly deepening, increasing the vertical length scale and thus the Reynolds number.
3
19
169
Hodograph, but the width of its lines is proportional to the shear magnitude, and it's colored based on the percentage of that shear that is streamwise.
Here's Pilger 2014:

7
19
162
Flow chart illustrating my general thought process when I try to evaluate tornado potential

1
15
157
May is all about the dryline, so here's a conceptual diagram illustrating how it evolves throughout a day

1
33
152

In addition to large ocean heat content, Helene's intensification will be aided by quasi-geostrophic divergence aloft as the storm enters the right entrance region of a jet streak on its approach to Florida.

2
24
151
Here’s how long it theoretically takes to form a tornado as a function of low-level mesocyclone intensity and the buoyancy beneath it. Derivation in the tweet below for those interested

4
17
147
(1/8) Let's do a deep dive on the dynamics behind "anabatic" winds (without math!!)

1
12
142
Today I passed my masters thesis defense! You can view a recording of the presentation here:

21
15
139
“Tornadic storm supercell rotates”

Tornadic storm supercell rotates and marches along the Texas prairie at sunset
145
953
6K
5
0
140
Yesterday's environment greatly contributed to prodigious flooding in Ft Lauderdale:
1) A supercell whose propagation perfectly cancelled out its advective motion, allowing it to be stationary
2) A deep warm cloud let warm rain processes dominate and efficiently produce precip

2
25
135
The dangerous fire near Boulder today that is prompting evacuations is being exacerbated by strong downslope winds. Here's an overview of the dynamics that are leading to today's windstorm.
#cowx

2
39
134
So-called “meteorologists” claim that the groundhog is “unscientific”, meanwhile Phil has compiled a 136 year climatology of Feb 2nd cloud cover in Punxsutawney, PA
3
7
137
NYC today is a great example of the difference between the Eulerian and Lagrangian time derivatives. A stationary thermometer measures decreasing temperature, but another thermometer drifting by with the wind would measure an increasing temperature (and both would be correct!)

2
13
135
Classic thunderstorm initiation with colliding outflow boundaries. Here are two (equivalent) perspectives on why these collisions produce such intense mesoscale lifting.
1
26
133
The vertical gradient of updraft speed near the ground is what fundamentally leads to tornadogenesis via vorticity stretching. There are 4 factors that contribute to its magnitude under a supercell:
-Integrated buoyancy
-Meso size
-Meso vorticity
-Meso proximity to ground


10
17
131

I made a Python script that plots RAP hodograph maps on top of current GOES-16 imagery


8
9
129
Winter forecasters will fine this one especially useful: vertical velocity in the DGZ weighted by RH. This will allow for more accurate assessments of dendrite growth, and I’m very excited to announce that the code is freely available on GitHub RIGHT NOW!
6
14
122
Simple trigonometric reasoning can be used to derive an expression for the vertical vorticity of a mesocyclone through tilting of streamwise vorticity. Strong storm-relative wind causes more gradual tilting, leading to *weaker* low-level mesocyclones, and vice versa.


4
22
114
Well it did the thing
The dynamics behind why these particular interactions can be so favorable for tornadoes are quite interesting


Would have to think that if any storm is gonna produce a tornado tonight, it would be this imminent gust front/supercell merger

1
1
15
2
20
115
@TwisterKidMedia
My first instinct when supercells inexplicably don’t produce is that the RFD is too cold, but I went back to check and… that’s not it either. I think anyone who confidently claims to have *the* explanation is out of their mind
7
3
108
I'm far enough along with my M.S. research that I can finally share some of my progress with you guys!
Thread (1/12):


6
20
114
I got RAP streamwise vorticity maps working! Potent low-level shear exists across the central plains right now, and the nocturnal jet hasn’t even kicked in yet...

7
19
112
I’m old enough to remember when fujiwhara was only done between a MALE and FEMALE hurricane; now we have to deal with WOKE storms during this so-called “pride month” 🤬

Beryl? Even our Hurricanes are gender non-binary now.
999
341
2K
6
6
112
The dynamics behind these events are complicated, but I’ve tried to put together a graphic to explain what is generally going on

Textbook profile for a downslope windstorm across the front range in Colorado as forecast by GFS for Sunday morning. Strong perpendicular wind impinging on the mountains and a rapid drop in static stability aloft is a tailor-made recipe for high-amplitude, breaking gravity waves.

2
5
29
1
23
109
I have adapted my mesoanalysis code to run on Google Colab. That means with *no* coding experience, you can generate these maps! All you need is:
-A web browser
-A Google account
-The ability to read and follow directions ;)
Link to get started in the tweet below

2
11
110
Q: What's the difference between hodographs of non-tornadic, weakly tornadic, and significantly (EF2+) tornadic supercells?
A: Low level shear

3
19
103
The Northern Mexico supercell printer is at it again today! Unique geography allows this area to produce spinning storms like clockwork this time of year.


3
8
103
Tonight it seems that many chasers either had insufficient knowledge of the dynamics and dangers of widening, HP supercells, or they understood but got too close regardless. Either way, a poor showing
9
7
104


Some discussion about an OFB focusing a tornado threat today, but why exactly is that the case? It has to do with sharp horizontal density gradients driving a vertical circulation that enhances low-level shear. That shear is streamwise for any storms moving parallel to the OFB


1
14
103
00z HRRR tracks supercells across N IL. SRH values are eye-popping, but SR wind does heavy lifting in this case as only ~60% of that LL shear is streamwise. With a thermo profile supportive of cool RFD, this hodograph doesn't scream efficient (supercell) tornado production to me

6
20
97
Terrain-influenced dynamics will play a critical role in tomorrow’s severe setup across Ohio. Blocking of boundary layer flow in the warm sector to the east will force quality moisture deep into Ohio and increase low-level shear; a dangerous combination for tornadoes.


2
21
101
I saw some epic supercell structure over Chicora, Pennsylvania this evening during my storm chase!

1
18
102
Important note for chasers who seek to get close to tornadoes: the maximum tangential winds *can* occur well outside the funnel cloud, even for a fully condensed tornado. Update to interactive funnel cloud visualization that depicts the velocity field:

Try out my interactive Desmos visualization of a tornado’s funnel cloud! This toy model assumes a rankine vortex structure and constant potential temperature to show how varying a tornado’s wind speed, width, and LCL pressure affects its appearance.


2
9
86
5
26
97
From the photos I'm seeing, streamwise vorticity tilting angles seem quite shallow at the moment. This is not great for tornadogenesis, but there's plenty of time for supercell characteristics to change


Tornado warned supercell, southwest of Clines Corners, NM. Partially obscured by terrain. Limited road network for observation. 3:01 p.m.
#nmwx
@NWSAlbuquerque

3
23
140
5
6
97
This may be a bit controversial, but environmental vertical vorticity (order e-5 to e-4 1/s) should be a negligible contribution to a supercell's near-surface vertical vorticity budget resulting from storm-scale processes.

8
14
98
I was lucky enough to “see” a streamwise vorticity current feeding into a supercell near Middleburg, PA yesterday thanks to some billowing Kelvin-Helmholtz clouds!


2
9
99
You can get decent estimations of tornadic wind structure from images by leveraging the fact that funnel clouds approximate constant pressure surfaces, along with cyclostrophic and hydrostatic force balances (the latter being tenuous but necessary to get a useable solution).

3
12
97
Tropical cyclones strengthen by latent heating in convection lowering the surface pressure. But how exactly does this work? Below I have derived a surface pressure tendency equation that shows why latent heating is such a big deal for these storms:

7
18
95
(1) was the mid-level reflectivity of one of many non-tornadic discrete supercells yesterday, while (2) was the presentation of the one tornadic discrete supercell SE of Birmingham. Supercell morphology is clearly important, even when all other parameters suggest a tornado threat


3
14
91
Entrainment is an important part of deep moist convection and it is ignored at one's peril

8
17
97
A *simplified* mathematical look at vorticity tilting, the mechanism through which supercells acquire their rotation, reveals that the efficiency of tilting depends on the ratio between updraft strength and storm-relative wind.

3
13
93
What an incredible photo!! Going off of proximity RAP soundings and assuming surface based convection, I'd estimate that this tornado achieved a pressure drop of around 130 mb at the time of this photo


5
16
91
Against my better judgement, I’ll throw my hat into the ring today. Deciding to storm chase on little or no sleep as part of “the grind” is not a risk that you assume alone; it’s a risk that you distribute to every other person you encounter driving, without their consent.
2
3
92
Scale analysis of the time it takes for stretching to amplify near-surface vertical vorticity to tornado-strength. Considering that 88D's scan at most every couple minutes, a lot of the temporal details of this process are often missed

3
10
91
Cool storm dynamics in SE Florida today! A storm along the coast started moving due south and thus began ingesting streamwise vorticity from the sea breeze’s mesoscale vertical circulation. Note that as soon as the storm stops moving south the mesocyclone falls apart
0
6
92


New hodograph type: Mass flux and buoyancy
Line thickness is proportional to the horizontal mass flux ρ*U_sr
Lines colored by the nCAPE of a parcel lifted from that level
nCAPEs weighted by mass flux to estimate the potential (undiluted) free tropospheric buoyancy of an updraft


7
20
91
Silver City tornado proximity hodograph with observed storm motion.

2
21
88
Averaging together the hodographs from the three Florida radars in the vicinity of the tornado outbreak reveals a potent vertical wind profile.

2
17
91
Mesoscale dynamics on display along a Red River OFB. Because the base state 0-1 km shear is so small, perturbations become obvious in mesoanalysis. Note how the shear vectors are pointing across the theta gradient from warm to cold, consistent with a thermally direct circulation.

8
11
89
Try out my interactive Desmos visualization of a tornado’s funnel cloud! This toy model assumes a rankine vortex structure and constant potential temperature to show how varying a tornado’s wind speed, width, and LCL pressure affects its appearance.
2
9
86
The 17z HRRR simulates a long-track supercell across Indiana. Using sfc wind and mass continuity, sfc dw/dz can be calculated which can then be used to estimate the tornadogenesis time scale following the storm. It bottomed out at around 6 minutes


3
11
87
As expected with a tornadic storm, tilting of low-level streamwise vorticity was quite abrupt


Clear slot / RFD arch surging from left to right in this image - I believe looking north at the
#tornado
in Florida
25
280
2K
0
12
88
16z notes:
-Large dryline convergence, especially from the OK panhandle through S NE
-Warm sector hodos are retaining low-level shear/curvature into midday thanks to the LLJ response to a deepening cyclone
-Large deeper layer shear is approaching from the west with the trough

2
16
85

Some further elaboration into why the hodograph shapes on Monday may not favor sustained mesocyclones.


Initial thoughts about MIDATL tor threat on Mon. Not quite sure what to make of the hodographs yet; discrete supercells may struggle to develop with very little shear from 2-6 km, especially if instability isn’t particularly robust. The low level shear is eye-catching regardless


3
7
45
4
14
84
Here’s an interesting perspective on synoptic dynamics:
Advection of (virtual) temperature by the geostrophic wind fundamentally *is* baroclinic production of vertical vorticity

1
10
84
00z Omaha sounding explains why a supercell in the area was able to produce large hail tonight.
-Large fraction of CAPE in the mixed phase temperature range
-15 m/s storm-relative inflow promoting a wide updraft
-Relatively weak low-level shear compared to cloud-layer shear

3
7
83
In a data set of over 15,000 right-moving supercell proximity soundings, 0-1 km layer-averaged streamwise vorticity was a noticeably better predictor of tornadoes than 0-1 km SRH. (Non-tornadic supercells in blue, tornadic supercells in orange)


10
13
85
Crudely simulating precip distribution using storm-relative hodographs as input (today in SE as example). Did it by calculating trajectories of particles w/ constant fall speeds dropped from various heights @ the origin. Pink dots are particles with larger fall speeds (i.e. hail)

6
8
83
Research Update: I have made significant progress in my M.S. research on supercell downdrafts and would like to share in the following thread!
3
10
80
The total mass of air evacuated by Hurricane
#Lee
so far as its surface pressure lowers comes out to about 90 *trillion* kilograms. If converted to liquid water, that's enough mass to fill up Yellowstone Lake...
...6 times over


2
21
78


Only two of these supercells are surface based, but I'm sure this run will get shared a bunch anyway

4
9
82