

Milos Makes Maps
@milos_agathon
Followers
29,460
Following
1,360
Media
2,163
Statuses
12,185
I paint the world with R and teach you how to unleash your inner map artist. Join my map adventures and tutorials now: ▶️
Joined December 2014
Don't wanna be here?
Send us removal request.
Explore trending content on Musk Viewer
Nasrallah
• 1129514 Tweets
حسن نصر
• 474227 Tweets
Palmer
• 404583 Tweets
الفتح
• 384492 Tweets
ارسنال
• 384092 Tweets
ليستر
• 378129 Tweets
Chelsea
• 247016 Tweets
Sant Rampal Ji Maharaj
• 228514 Tweets
Sanchez
• 137603 Tweets
سوريا
• 117872 Tweets
巨人優勝
• 112880 Tweets
フリーレン2期
• 104309 Tweets
Brighton
• 94448 Tweets
Wolves
• 77536 Tweets
Saka
• 74337 Tweets
Leicester
• 73154 Tweets
Sancho
• 70639 Tweets
Osimhen
• 61077 Tweets
#KC_HBD
• 55201 Tweets
#岸優太誕生祭2024
• 39155 Tweets
#GSvKAS
• 34777 Tweets
Sundowns
• 26174 Tweets
Foden
• 26099 Tweets
Nwaneri
• 25754 Tweets
Martinelli
• 25601 Tweets
Madueke
• 18720 Tweets
Leverkusen
• 17498 Tweets
Icardi
• 15353 Tweets
岸くん29歳
• 14940 Tweets
Kentucky
• 14085 Tweets
Calafiori
• 13876 Tweets
Rosie Duffield
• 12168 Tweets
パーマー
• 10731 Tweets


Pinned Tweet

💡Today is a special day for all map lovers: GIS day🌍!
And I'd like to warmly welcome you to my YouTube channel where I teach you how to create stunning maps with R🙌🏻
Seize this opportunity to level up your skills ✅
Check it out and subscribe now:
🔗
4
9
86
Happy to share my new map of tree cover in Europe!
#europe
#forest
#nature
#RStats
#DataScience
#dataviz
#maps
#geospatial

37
794
4K
My new map shows human settlements in Argentina. The most populated parts are central & eastern regions, with Buenos Aires metropolitan area housing 2,630 people per km². The western & southern regions, such as Patagonia, have density of less than 1 person per km² in some areas😮

140
491
3K
Delighted to showcase my latest work: a 3D land cover map of Turkiye. Created with the Esri dataset, it highlights the country's rich landscapes and land classes.
Map enthusiasts, check out my tutorial for tips and start mapping:

38
285
3K
Europe's population changes from 1990 to 2020 will blow your mind! 😱 I used the latest GHSL population grid to map this amazing transformation. 🗺️ Can you see the trends? 🕵️
If you want to learn how I do it, watch my video and get inspired! 🔥👇
🔗

59
647
3K
Hi, are you interested in making pretty & useful maps like those in the screenshot below but you don't want to pay for expensive GIS courses? 🗺️
Look no further: I created FREE tutorials for YOU 🙌🏻👇🏼
#RStats
#DataScience
#dataviz
#coding
#maps

38
416
2K
My new map shows the % of female researchers in Europe, according to UNESCO data. Link to the data source is in the map just below the legend.
👩🔬
#women
#science
#womenintech
#rstats
#maps
#dataviz
#DataScience

57
808
2K

You've probably seen this map on social media, but do you know who made it? Me. I used the 1931 Yugoslav census, optical recognition and georeferencing to create this widely circulated map.
#GiveCreditWhereItsDue
#MapGeek
🙌


16
112
2K
I mapped % of the population with a university degree or higher 🧐😏🤓
#education
#university
#RStats
#DataScience
#maps
#dataviz

62
280
1K
This 3D map of Turkiye’s tree canopy height is mind-blowing! 😲 It shows the amazing diversity of the forest from the lowlands to the mountains. 🌲🌳
You can make your own maps like this too. Just watch my video here:

11
167
1K
My new map shows the population change (%) between 2017 and 2021, according to Eurostat. 😢
#population
#RStats
#DataScience
#maps
#dataviz
#geospatial

25
229
1K
Today is the International Day of Women and Girls in Science and I mapped the % of female researchers in Europe, according to UNESCO data.
#women
#science
#womenintech
#rstats
#maps
#dataviz
#DataScience
#WomenInScience

23
425
1K
I'm thrilled to share my first tutorial in 2023 on mapping the population with R!
Using this 6-in-1 post you can map other European countries!
#population
#RStats
#DataScience
#dataviz
#geospatial
#maps


21
154
994

On the International Day of Women and Girls in Science I mapped the % of female researchers in Europe, according to UNESCO data. 👩🔬👩🏫👩🎓
#WomenInScienceDay
#WomenInScience
#rstats
#DataScience
#geospatial
#DataVisualization
#maps

21
375
962
My new map shows the % of employed in manufacturing, using Eurostat's latest data. 🏭👨🏭👩🏭
#manufacturing
#industry
#Europe
#RStats
#DataScience
#dataviz
#maps
#geospatial

17
230
925
My new map shows the % of children ages 0-4 in total population, using Eurostat's latest data 👶🍼👼
#Children
#Europe
#RStats
#DataScience
#dataviz
#maps
#geospatial

27
308
848


On the International Women's Day I mapped the % of female researchers in Europe, according to UNESCO data. 👩🔬👩🏫👩🎓
#InternationalWomensDay
#rstats
#DataScience
#geospatial
#DataVisualization
#maps

20
321
779
Check out my last tutorial on mapping rivers in R if you'd like to make a similar map of European rivers! 🥳
💻
#rivers
#africa
#datavisualization
#visualization
#dataviz
#RStats
#DataScience
#maps

13
136
756
My new map shows the food inflation rate in Europe. 😲Top 3 countries with the highest food inflation rate:
🥇Turkey🇹🇷 54.3%
🥈Hungary🇭🇺 28.4
🥉Serbia🇷🇸 24!
#food
#inflation
#economy
#Europe
#RStats
#maps
#geospatial

35
222
729
My new map shows the forest cover of Romania🇷🇴
More 🟢 = more 🌳
32% of Romania's land area is covered by natural forest!! Romania is also a home to virgin forests, where over 250k hectares of ancient trees shelter over 60% of Europe’s brown bears & other majestic creatures! 🐻

17
79
725
My new map shows the GDP per capita adjusted by purchasing power, according to Eurostat
#gdp
#RStats
#DataScience
#maps
#dataviz
#geospatial

20
150
721
I’m excited to share my new tutorial on how to create stunning 3D maps of forest canopy height in R with
#ggplot2
&
#rayshader
! 🌲🌎 Click the link below & join me on this 3D mapping adventure. You will have a blast & learn new skills along the way. 🚀
🔗

7
145
691
My new map shows the inflation rate in June 2023, acc. to Eurostat. Euro area inflation rate was 5.5 %, down from 6.1 % in May 2023.
Some still struggling with high inflation:
🇹🇷Turkiye 38.3&
🇭🇺Hungary 19.9
🇷🇸Serbia 13.5
#inflation
#economy
#geospatial
#rstats
#maps
#dataviz

8
404
683
Created a spike map of Europe's buildings using Copernicus satellite data 🏙️
The original is 47 MB large but Twitter massacred it so I'm posting snapshots of several areas below 👇
#europe
#infrastructure
#RStats
#DataScience
#dataviz
#maps
#geospatial

18
113
678
Young MALES 👨🎓 with university degree (left)
Young FEMALES 👩🎓 with university degree (right)
#education
#HigherEducation
#europe
#dataviz
#maps
#rstats


18
247
609
I have exciting news to share! 😍
My new tutorial shows you how to easily access World Bank datasets & create crisp animated maps on the global, continent, & country levels
#tutorial
#RStats
#DataScience
#dataviz
#maps
#geospatial

2
114
614
On International Day of Women/Girls in Science, my map shows STARK differences in % of female researchers across Europe
HIGHEST %:
🇲🇰MKD 52.3%
🇱🇻LVA 52.2
🇱🇹LTU 51.6
🇷🇸SRB 50
LOWEST %:
🇳🇱NLD 25.8
🇨🇿CZE 26.8
🇫🇷FRA 27
🇩🇪DEU 28
#womeninscience
#dataviz
#DataScience
#maps
#rstats

26
335
576
My new map shows the % of people ages 25-64 with university degree.
#highered
#university
#RStats
#DataScience
#dataviz
#maps

19
154
565
My latest map shows median age of mothers at childbirth, according to the most recent Eurostat data 👩👧👦🤰
#mother
#fertility
#Europe
#RStats
#DataScience
#dataviz
#maps

20
157
569
I’m happy to announce my 20th video on YouTube 🎉 This one is special, because it shows you how to map poverty using NASA data in R.
🔗
Give it a thumbs up 👍 if you like it, and subscribe!
#tutorial
#coding
#rayshader
#ggplot2

7
85
537


🌲🌲🌲 This map will blow your mind! It’s not just colors, it’s the amazing diversity of Romania’s forests!
Romania has a highly forested land in Europe (🟡 🔵 ❤️on the map), and it’s a wildlife wonderland!
If you are curious about how I created this map, watch my video and

7
71
472
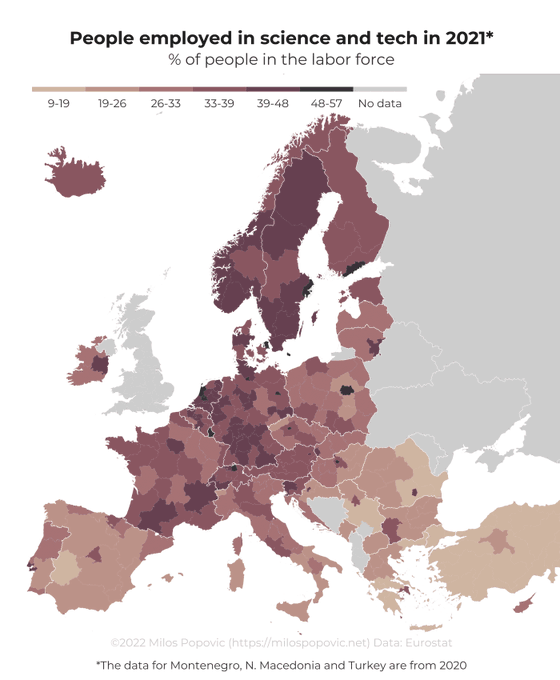
👋 Hi, friends! My new map shows how many people work in manufacturing in different regions of Europe. 🏭
📊 I used the latest data from Eurostat, the official statistical office of the EU. 🇪🇺

11
111
429
My new map shows the average forest height on the Iberian Peninsula, which is a home to some of the tallest forests in the world, where the trees reach for the sky like giants

4
80
414
My dot-density map shows the religious composition of Yugoslavia. Every dot is 100 randomly assigned individuals within the boundaries of their municipality of residence. I used topographic overlay & darker background are mountains.
#dataviz
#DataScience
#RStats
#rspatial
#maps

16
90
405
Hi everyone, I toyed with the Kontur population dataset and created this 2022 population map of Europe for you. It looks like a traffic jam at the heart of the continent 😂😂😂
#population
#RStats
#DataScience
#dataviz
#maps
#GeoSpatial

16
101
402
You have to see my new map of Iberia’s 🇦🇩🇪🇸🇵🇹 elevation and urban areas, made with Esri Living Atlas of the World. 🗺️
Want to make similar maps?
Find out how 👇👇👇
🔗

7
73
409
My new map shows the % of the population with a university degree or higher (MA, PhD) by NUTS region using the 2022 Eurostat data!
#education
#highered
#geospatial
#RStats
#DataScience
#dataviz

14
110
402
How far is the national motorway from every settlement in
🇭🇷Croatia
🇲🇰N. Macedonia
🇷🇸Serbia
and 🇸🇮Slovenia?
#motorway
#road
#infrastructure
#dataviz
#datascience
#BigData
#geospatial
#maps
#rstats


24
110
389
👇Behold the beauty of Italy in 2022!👇 This stunning map shows the elevation and urban areas using Sentinel 2 data. 🛰️
🗺️ Want to learn how to make your own maps similar to this? Watch my video now and become a master of mapping! 🎥👍
🔗

6
53
381
I mapped 51,426 out of 52,511 identified Jewish victims in occupied Yugoslavia (1941-1945). Most Jews perished in
Sarajevo 8330
Zagreb 7222
Skopje 5183
Bitola 3454
Novi Sad 2931
RIP🥀
#Holocaust
#HolocaustMemorialDay
#HolocaustRemembranceDay
#dataviz
#DataScience
#maps
#rstats

15
142
363
I mapped CO2 emissions in Europe in 2021
#CO2
#greenhouse
#environment
#europe
#RStats
#DataScience
#dataviz
#maps

14
104
367
My new spike map shows the 2022 population density of the Iberian peninsula🇵🇹🇪🇸
#iberia
#espa
ña🇪🇸
#Portuguesa
🇵🇹
#spain
#portugal
#RStats
#DataScience
#dataviz
#datavisualization
#visualization
#mapping
#cartography
#maps
#gischat
#gis
#rayshader
#geography
#population
#world

9
68
367
My new map shows the rivers of the Iberian peninsula 🇪🇸🇵🇹, colored by the basin they belong to and adjusted by their size

10
67
354
My new map shows the inflation rate in May 2023 based on Eurostat data 💸
Top 3:
🥇Turkey 🇹🇷
🥈Hungary 🇭🇺
🥉Serbia 🇷🇸
#RStats
#DataScience
#dataviz
#maps
#inflation
#Europe

12
134
354
My new map shows the population change (%) between 2017 and 2020, using Eurostat data
#population
#Demography
#depopulation
#europe
#RStats
#maps
#dataviz
#gis

17
106
343
My new 3D map shows the elevation of France🇫🇷 overlayed with the dominant land cover type in 2022 🏞️🌇🌳
Curious how I make these maps? Check the link to my video in the comments section below ⏬

2
44
342
💥My new map of Argentina’s population change will blow your mind! 👇
Can you spot the patterns and guess what caused them? 🕵️♂️
Don’t miss my video where I show you how to make awesome maps with R and Global Human Settlement data. You’ll be amazed by what you can do! 🙌
Video:

11
62
345
My new map shows COVID19-related deaths per 1 million inhabitants in Europe.
#COVID19
#dataviz
#datascience
#rstats
#maps

20
183
319
My new hex map shows carbon emissions in 2021🔥
Data:
#RStats
#DataScience
#greenhouse
#CO2
#dataviz
#maps
#gischat

8
82
322
My new map shows the 2022 average annual nightlights for North and South Korea 🇰🇵🇰🇷. The border is in 🟥

14
109
317
🇹🇷My new map shows Turkiye's seismic activity, showcasing over 20,000 earthquakes above magnitude 2.5. It's a century of data at a glance! Spot the hotspots?
🛰️🎓 Want to map seismic data yourself? My tutorial makes it easy.
👉 Check it out:

4
60
322
I created the most detailed maps of Orthodox (left) & Roman Catholic (right) Christians in the Kingdom of Yugoslavia based on the 1931 census data for 4645 municipalities, which I geocoded myself
#history
#census
#Yugoslavia
#dataviz
#DataVisualization
#maps
#rstats
#gis
#coding


3
56
308
My map draws your attention to % of people in Europe who can't afford some of the basic things.
#poverty
#dataviz
#maps
#rstats
#DataScience

14
160
307
Today is the International day of forests and I created a tree cover density map of Europe on the local administrative unit (LAU) level, using the most recent satellite data from Copernicus Land Monitoring Service
#ForestDay
#Forests
#dataviz
#DataScience
#maps
#rstats

3
100
303
🚀 I'm thrilled to share my latest tutorial on how to download, set up, and customize Positron, the cutting-edge IDE that integrates native R and Python kernels into VSCode. Perfect for data scientists and developers!
🔗 Watch here:

1
65
319
I mapped Iran's 8,000+ quakes to reveal its seismic story in the past 100 years
Interested in data visualization? My R tutorial shows you how to map such data anywhere:

5
54
263
My latest map uses Copernicus satellite data to show the % of land cover under buildings in 2019
#infrastructure
#RStats
#DataScience
#dataviz
#maps

4
55
308
Check out my timelapse map of regional unemployment in Europe!
#unemployment
#economy
#europe
#datavisualization
#dataviz
#maps
#rstats
3
172
301

I mapped the road traffic deaths per 1 million inhabitants using Eurostat's latest data 🚗⚰️
#traffic
#RStats
#DataScience
#geospatial
#dataviz
#maps

9
79
297
Indeed, the number of COVID-19 caees in Italy is rising.
BUT
Take a look at the average daily change in cases for the last week prior to general quarantine (RIGHT) vs. last 10 days after the general quarantine (LEFT).
#ItalyCoronavirus
#italylockdown
#Italy
#maps
#rstats


13
120
294
🌍 Happy International Day of Women and Girls in Science! 🎓 I made a map to show you the % of female researchers in Europe. Azerbaijan is
#1
with 55.4%! 🔬
#WomenInSTEM
#ResearchEquality

12
99
299


Today is the World Day of Social Justice so I mapped regions at risk of poverty, according to Eurostat😢
Top 5 poorest regions:
38% Sicilia🇮🇹
37 Campania🇮🇹
35 Nord-Est🇷🇴
35 Isole🇮🇹
33 Macroregiunea doi🇷🇴
#WorldDayofSocialJustice
#rstats
#DataScience
#maps
#dataviz
#geospatial

19
72
295
Podseti me šta su to
SLOBODA govora
SLOBODA medija
SLOBODA intelektualnog stvaralaštva
#rstats
#dataviz
#data
#FreedomOfThePress
#balkans
5
118
288
My new map shows CO2 emissions per capita in Europe in 2021
#CO2
#greenhouse
#environment
#RStats
#DataScience
#dataviz
#maps

24
71
290
France is a forest lover's paradise. 🌲🌳🌲
Check out my new map that shows how green and diverse France's forests are. Can you find your favorite one? 🌳
You can make your own map like this too. Just watch my video tutorial here:
If you love this post,

6
69
287
Wow, what a weekend for the map below with nearly 200k views in just 2 days!
I'm happy that you found this plot useful so I prepared a short tutorial on reproducing it in R
👇🏼👇🏼👇🏼
#RStats
#maps
#dataviz
#DataScience
#Datavisualization

5
59
287
I'm thrilled to announce my latest video on how to interpolate air pollution data & create beautiful 2D and 3D choropleth maps using
#ggplot2
and
#rayshader
in R
Check it out here 🔽🔽🔽
🔗

2
48
287
I mapped 3-year average measures of particulate matter (PM) 2.5 using EEA's Annual AQ statistics and boy the Balkans and East Europe surely look bad 😢
#environment
#pollution
#RStats
#DataScience
#dataviz
#maps
#geospatial

14
59
286
My new map shows active railways in Europe according to OpenStreetMaps (OSM) data! 😍
#railway
#RStats
#DataScience
#DataAnalytics
#maps
#dataviz
#coding

7
55
284
Hey people, I prepared a video tutorial on making POWERFUL 3D maps with
#rayshader
&
#ggplot2
in R!
🔗
#tutorial
#coding
#RStats
#DataScience
#dataviz
#maps
#gischat

6
64
282
Bumped into my illiteracy map of the Kingdom of Yugoslavia online. Reminded me of my work in progress on the effect of the military frontier on illiteracy in Yugoslavia (1931-1991), in which we find that it took nearly 3 generations to diminish stark differences on the map.

20
72
268
Wow! Look how much Iberia🇦🇩🇪🇦🇵🇹 has changed in 30 years! 😱 My new map shows the population growth & decline across the peninsula, using the Global Human Settlement data 📊
🗺️ Want to learn how to make maps like this with R? 😍 Check my video 👇🏼👇🏼👇🏼
🔗

9
64
282
My Instagram account mapvault has organically doubled to 10,000 in a year time to. Join my page where you'll find over 400 maps that I created using R, ggplot2 and open data!
#instagram
#dataviz
#DataVisualization
#DataScience
#RStats
#artwork
#VisualArt

7
36
283
👋 My new map shows you the elevation of the land and the 2022 tree cover in Iberia, which includes Andorra, Portugal, and Spain. 🇦🇩🇵🇹🇪🇸 The green color shows the trees 🟢
🌳 According to the data I used, Iberia had around 27% of tree cover in 2022, which is similar to 2018

4
48
277


My new map shows Europe's food prices in May are trying to set a new world record in the high jump 😲
Top 3 countries with the highest food inflation rate:
🥇Turkey🇹🇷 52.2%
🥈Hungary🇭🇺 33.2%
🥉Serbia🇷🇸 25.7%!
#food
#inflation
#rstats
#DataScience
#dataviz
#maps
#geospatial

13
89
272
My latest map shows a fascinating regional variation in median age of women at childbirth (live births only). Check it out!
🇪🇸Spain's regions are ranked among the top 10 oldest in Europe
#childbirth
#fertility
#dataviz
#DataScience
#GeoSpatial
#maps
#RStats

14
126
262
I mapped gross disposable income of households per capita adjusted by purchasing power parity, according to Eurostat's latest data
😏Richest: Luxembourg 🇱🇺
😳Poorest: Serbia 🇷🇸
Data & definition:
#RStats
#DataScience
#dataviz
#maps
#geospatial

11
79
264

My new 3D map shows the elevation of Germany🇩🇪 overlayed with forest type 🌳🌲

7
36
263
You won’t believe how diverse Bosnia’s population is! 😍 I used R to make this 3D relief and dot-density map of the ethnic groups in each settlement according to the 2013 population census. Can you tell them apart? 🤔
#BosniaHerzegovina
#BIH
#RepublikaSrpska
#census
#demography

13
41
258
Excited to share my new 3D elevation map of Germany, with scaled river systems.
Visual learners, rejoice! I've put together a YouTube video that takes you through the process of crafting 3D elevation maps and scaling rivers. Access it here:

7
38
269
Hey people, I'm back with another tutorial and this time I show you how to create stunning river basin maps with R and
#ggplot2
🏞️
🔗
#RStats
#DataScience
#tutorial
#coding
#geospatial
#maps
#dataviz

2
53
264
Hi everyone!
I'm back with another YouTube tutorial, this time showing you how I make Eurostat maps with R 💚
May the 4th tutorial be your good guide to pretty maps! Happy coding!
#Tutorial
#RStats
#DataScience
#dataviz
#maps
#geospatial

2
41
259
On World Cancer Day, my new map shows cancer death rate in Europe. Regions in 🇭🇺Hungary & 🇷🇸Serbia have the highest rates in Europe!
#cancer
#cancerday
#WorldCancerDay
#worldcancerday2021
#health
#dataviz
#visualart
#DataScience
#maps

15
137
250
Check out which Euro regions have the highest share of households with access to the Internet in my latest map!
#InternetShutdown
#tech
#network
#Europe
#DataScience
#dataviz
#ddj
#rstats
#maps
#gis
#artwork
#VisualArt

13
91
247
My new map shows the rivers of Africa 😍
Data:
#rivers
#africa
#RStats
#DataScience
#dataviz
#datavisualization
#maps
#geospatial
#rspatial

2
44
250
Today is World Forest Day when we
celebrate & raise awareness of woods!
I mapped forest tree cover in Europe, Africa, and South America
🔽🔽🔽
#europe
#ForestDay
#WorldForestDay
#RStats
#DataScience
#dataviz
#maps
#geospatial

7
66
245
I created the breathtaking 3D forest cover map of Africa's majestic forests using the power of R,
#ggplot2
, &
#rayshader
. Prepare to be mesmerized by the beauty & importance of our planet's green lungs!
#RStats
#DataScience
#GIS
#EnvironmentalScience
#DataVisualization
#maps

7
47
247
My Instagram account has organically grown from 450 to 5,000 followers in the last 6 months. Join my page where you'll find nearly 300 maps that I created using R, ggplot2 and open data!
#instagram
#dataviz
#DataVisualization
#DataScience
#RStats
#artwork
#VisualArt

5
23
243