
Infogram
@infogram
Followers
16K
Following
3K
Statuses
14K
📊 Engage your audience with unique #dataviz, infographics, social media posts, and more.
Everywhere
Joined May 2011
Creating #dataviz projects should be effortless! Infogram's #AI tool makes creating data visualizations fast and easy for everyone. Generate charts, craft #infographics, and make your message more impactful - all with the help of AI. ✨ Learn more:
1
1
2
💘 Experience gifts are becoming the new Valentine’s Day favorite! Our line chart shows how giving experiences has steadily risen over the years. ✨ Create visuals like this with Infogram! #ValentinesDay #ValentinesDay2025

0
0
1
🚀 What’s new on Infogram? ✨ Data animations: Add motion to line charts. 🎨 Accessibility patterns: Make visuals inclusive with patterns. 💡 Tooltip customization: Tailor tooltips with light, dark, or transparent modes. Ready to try? Start creating today!
0
0
0
Need accurate maps for your data? Infogram lets you locate regions, cities, and countries with ease, even when you have a typo. Create stunning, precise maps for any project! 🤩💡 #Interactive #Maps
0
0
0
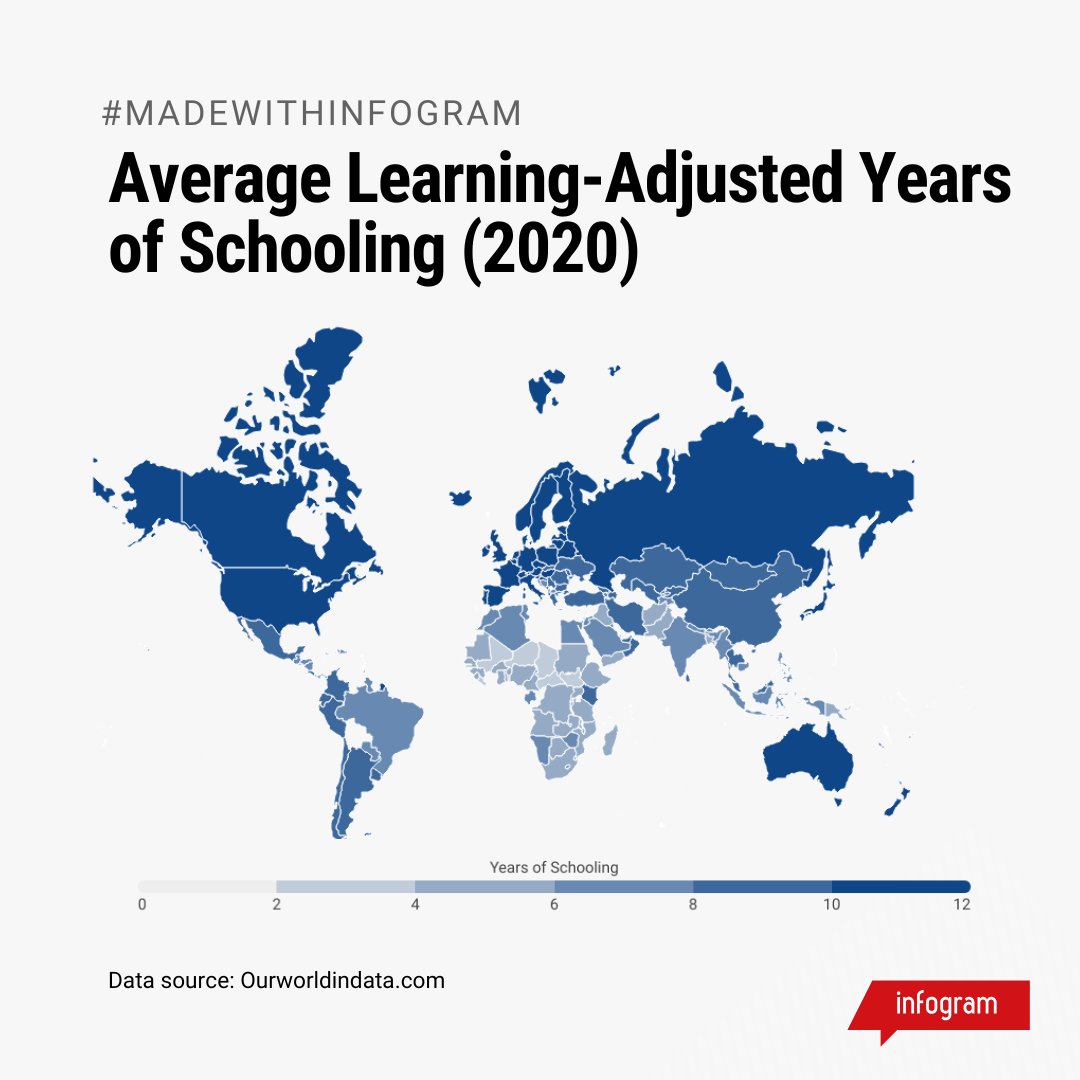
Education is key, but years in school vary globally. See our visualization of Average Learning-Adjusted Years of Schooling (2020) and the disparities that exist. 📚 #InternationalDayOfEducation #DataVisualization
0
0
2
Learn the key tips for visualizing a process—from flowcharts to timelines, we’ve got you covered with design tips to make complex steps clear and engaging. 💡 👉 Read more:
0
0
0
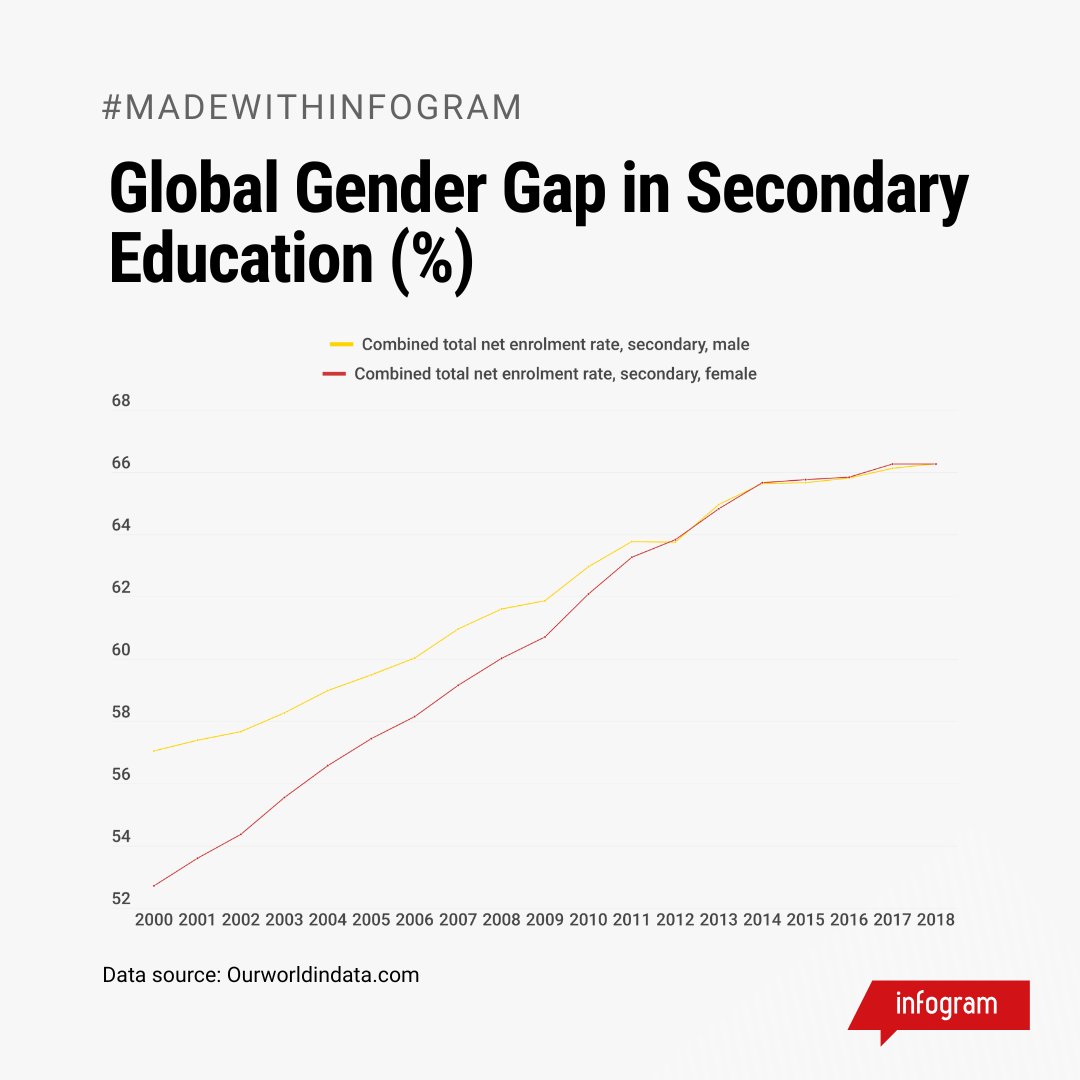
See our visualization of the Global Gender Gap in Secondary Education (%), showing where progress has been made. 📊 Let’s push for equal education opportunities worldwide. Create visuals like this with Infogram! 💡 #DataVisualization #GenderEquality
0
0
1
Learn how to design impactful data visualizations for environmental science. From climate trends to biodiversity maps, see how to turn data into action. 🌍💡 👉 Read here: #EnvironmentalScience #DataViz #ClimateAction
0
0
1
This visualization reveals global and regional trends in annual CO2 emissions. It’s time to turn data into action for a sustainable future. 🌱 Create visuals like this with Infogram! 💡

0
0
0
Designing interactive visuals? Avoid common mistakes! 💡 Check out our guide to creating engaging, user-friendly visualizations that tell a story.


0
0
0
Winter temperatures are rising: See global winter temperature anomalies (1970–2024) and how recent years reveal sharp climate changes. ❄️📈 Want to make impactful visuals like this? Use Infogram to bring your data to life. #ClimateChange #DataVisualization

0
0
0
The world of data is evolving, and visualization tools are taking center stage. ⭐ From AI-powered insights to dynamic data monitoring. 👉 Read and explore expected trends of 2025:
0
0
0
As we wrap up the year, marked by innovation and creativity, we’re celebrating the top 12 creative data visualizations of 2024 by Infogram users! 🎉📊 From dynamic charts to stunning dashboards, see how data came to life this year. Read the article here:
0
0
0
Adjust bar widths in your bar charts with Infogram, making tailored, unique designs easier than ever. Ready to level up your visuals? 🤩 Try it out today! #DataVisualization
0
0
0
Want to know how spend & share break down by device in 2024 for BNPL? Check out our visualization and get the insights. 💡 Want to create visuals like this? Use Infogram to make your data shine. 🤩

0
0
0
Want to create effective progress charts? 💡 Check out our visual guide to the dos and don’ts of creating effective charts. Want to design your own? Use Infogram to take your visuals to the next level! 🤩


0
0
1
The 2024 holiday shopping season is just around the corner, and device-specific trends are worth watching. 👀 Which device is leading the charge? To make visuals like this, use Infogram to turn your data into insights. 💡 #HolidayShopping #EcommerceTrends

0
0
0
New on Infogram! 🤩 📍 Find detailed locations on maps 🔗 Add interactivity with object links 🎨 Gradient options for progress charts 📊 Adjust bar widths for bar charts Level up your visualizations now!


0
0
0
AI is revolutionizing industries worldwide, and its market size is set for incredible growth in the coming years. 💡 With Infogram, you can easily turn insights into compelling, shareable graphics. 📊 #ArtificialIntelligence #DataVisualization

2
2
2
Wondering which channels drive Cyber Week sales? 📊 This doughnut chart shows which marketing channels are most effective. Get data-driven insights to boost your Cyber Week strategy with Infogram’s easy-to-use tools! #CyberWeek2024 #DataVisualization

0
0
0