

Grid Status
@grid_status
Followers
7K
Following
698
Statuses
450
Stay informed on the real-time status of the US Electric Grid with comprehensive monitoring and data
Joined August 2022
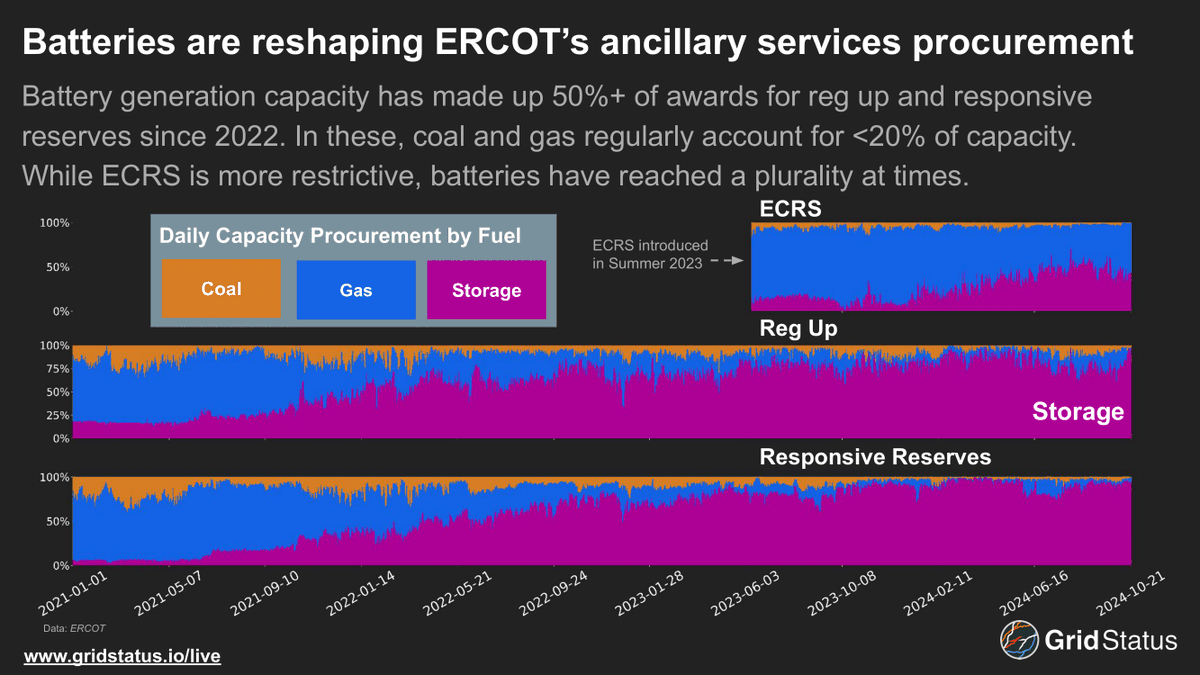
Batteries are reshaping ERCOT’s ancillary services procurement Battery generation capacity has made up 50%+ of awards for reg up and responsive reserves since 2022. In these, coal and gas regularly account for <20% of capacity. While ECRS is more restrictive, batteries have reached a plurality at times.
7
29
167
We get a lot of questions about data on the nodal map. While we have real-time and historical price data for every node across the US, in order to provide a public map we manually collect information from a wide variety of sources to show a significant sample of available nodes. Over the past week alone we added over 150 new nodes focused on PJM. These new nodes focused on capturing consistent congestion patterns, important legacy generators (like hydropower), emerging trends such as solar on the RTO’s southern border, and the famously constrained Delmarva Peninsula. Feel free to reach out if there are specific spots on the grid where you’d like to see more map coverage!

2
2
28
Today the PJM Interconnection set a new winter demand record, ~145GW, displacing a decade-old peak Prior to the new record, only a single day had cracked the winter top ten in the last ten years. Impressively, the RTO accomplished this while exporting ~8 GW to neighbors. In part, to Tennessee Valley Authority, who set a new all-time demand record this morning with 35.3 GW. This eclipsed last January's record-breaking 34.6 GW. TVA is certainly hurting for missing a unit at both Watts Bar and Sequoyah the last few days as well, so that interchange likely played a larger role than normal. It also appears that Midcontinent Independent System Operator (MISO) was within ~1 GW of their winter record, while ERCOT had its second highest demand winter day ever. The eastern half of the country has quite a ride of winter weather to start the year.

2
12
73
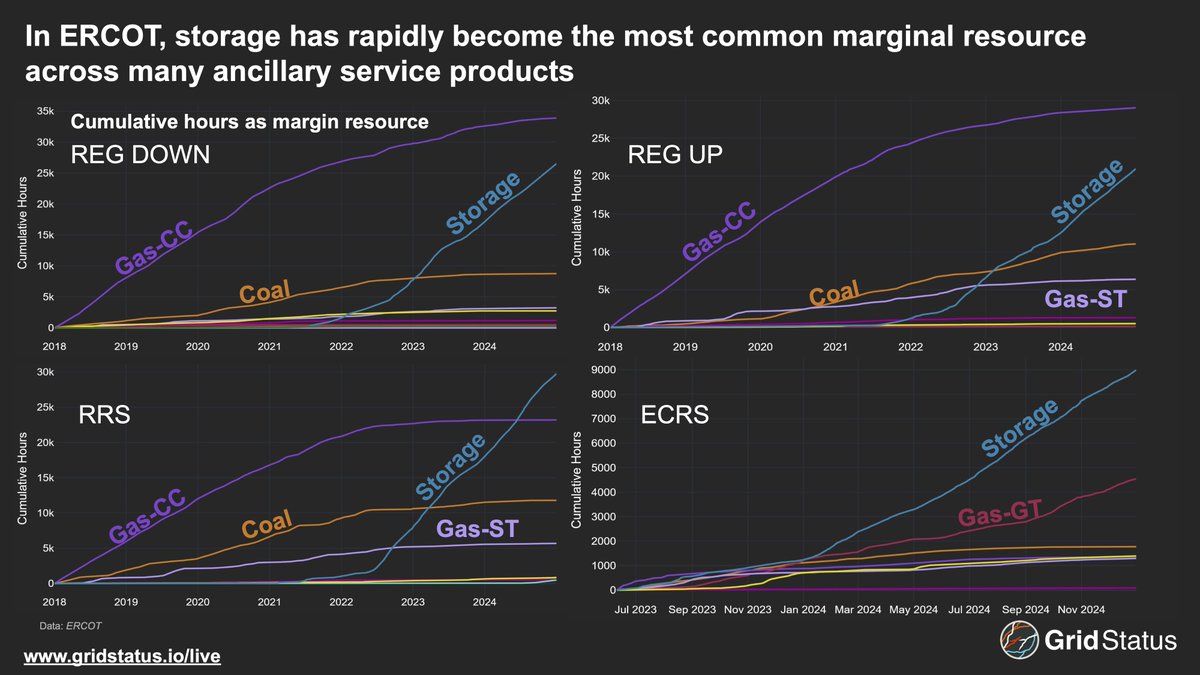
RT @maxk: The speed at which batteries have taken over ancillary services in ERCOT is impressive!
0
44
0
As winter storm impacts mounted in PJM, the AP South internal interface exceeded its warning limit, triggering price separation via congestion. As snow settled in over the Mid-Atlantic, Dominion’s demand exceeded AEP’s, a result of both storm placement and a greater reliance on electric heating


0
3
22
And here's the link to elsewhere that the algorithm doesn't want you to see 😉
0
0
5
That’s it on the 2024 round up, look out for more regular grid event analysis and long-form blogs in 2025! We're also about to launch a new way to access data on Grid Status (for you non-technical folks) and have many more features percolating

0
0
6
This is our only post for the week, look for more as we close out the year and enter 2025!

0
0
7