
cinyc
@cinyc9
Followers
11,184
Following
948
Media
5,839
Statuses
44,357
Maps and politics and stuff. Usually, it's just maps. Disclosure: Conservative Republican. Maps: .
Joined April 2017
Don't wanna be here?
Send us removal request.
Explore trending content on Musk Viewer
namjoon
• 345951 Tweets
Linkin Park
• 156583 Tweets
Adalet
• 138014 Tweets
FOR ASIA
• 123469 Tweets
BTS PAVED THE WAY
• 84214 Tweets
Chester
• 81106 Tweets
علي النبي
• 79573 Tweets
小泉進次郎
• 59762 Tweets
Hayırlı Cumalar
• 49643 Tweets
#يوم_الجمعه
• 34670 Tweets
エイリアン
• 32686 Tweets
知的レベル
• 30194 Tweets
資さんうどん
• 29932 Tweets
GRABTOUR LINGORM
• 28507 Tweets
すかいらーく
• 27005 Tweets
大阪府警
• 20282 Tweets
MARK TUAN BD FAN MEETING
• 19993 Tweets
ベイマックス
• 17462 Tweets
Milli Savunma Bakanlığı
• 16324 Tweets
フリーランスの田中
• 13709 Tweets
神ちゃん
• 10898 Tweets
#ガラッとチェンジマン
• 10515 Tweets


Pinned Tweet

Tutorial on how to make a map using QGIS. I'll turn
@SenhorRaposa
's 2000 Vermont town data into a map showing by how much Gore outran Senator Jeffords (or vice versa) in every town.
Step 1: Download QGIS for your computer, which is available here:

17
45
371
@NateSilver538
A team from 4th largest metro vs the 10th largest metro. Not everything revolves around the NE Corridor and the evil Trashtros.
19
15
2K
Hearing rumors of massive turnout on Long Island relative to NYC.
Almost 350K voters have voted in Suffolk County as of 3PM. That's almost 230K today alone: 189.66% of their early vote, and 31.55% of total RVs (Early + ED).
36
211
1K
Wick Insights PA Poll:
Oz 49.1%
Fetterman 44.6%
Someone Else 3.4%
Shapiro 48.5%
Mastriano 46.4%
Someone Else 1.8%
(1013 LV; October 8-13; MoE +/-3.1)
76
221
975
@katieporteroc
Most Americans right now, after reading this message about a rigged election that wasn't:
10
21
804
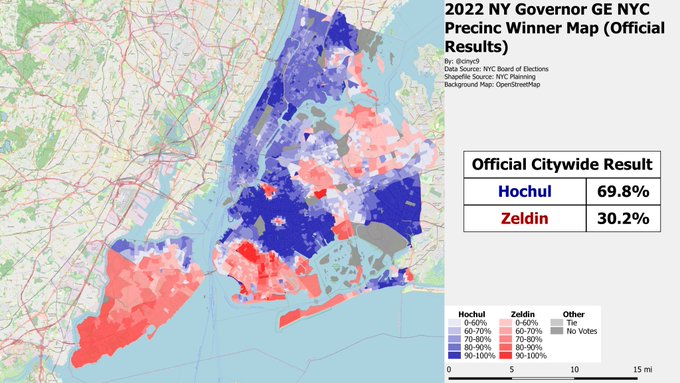
NYC's results are now official.
@LeeZeldin
received 30.2% of the citywide vote. Here is the precinct winner map:
37
97
536
There's a new pollster in town called SoCal Research. They're currently included in the 538 average.
But who are they and how are they actually polling?
A 🧵
1/11
12
59
492
“Ceasefire” received 71 votes in the NH college town of Durham. 1710 total votes were cast, so in one of its best possible towns, “Ceasefire” received 4.2% of the vote.
Biden won the town - and the overwhelming majority of WIs with 1,205 votes (70.5%).
4
72
432
Joe Biden won the city of Chicago 82-16. Yet as the precinct map below shows, Donald Trump did win some precincts, largely near the airports and Evergreen Park.

23
78
382
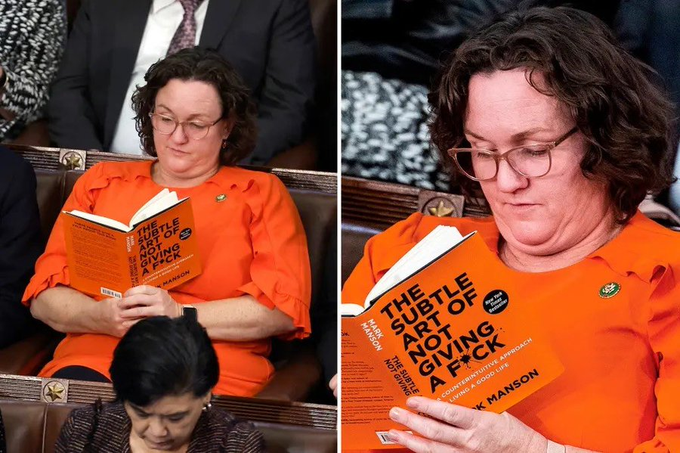
Next up from What's happening: People are confused by a Tweet saying Andrew Cuomo enacted policies that killed nursing home patients and sexually harassed women, given that Governor Cuomo is an Emmy Award winner whose book was read by thousands.

2
101
359
Updated Seattle Sawant Recall Result as of today:
Recall Yes 20,183 49.71 %
Recall No 20,415 50.29 %
11
25
281
The U.S. Census Bureau finally released the 2020 Census ancestry and racial subgroup data on Thursday. More on this to follow in this thread.
My interactive map of the Top Ancestry or Racial or Hispanic subgroup in every US census tract is now live:

14
78
262
Census released its 2015-19 5-year American Community Survey on Thursday.
Here's this year's nationwide Top Ancestry or Hispanic or Racial Subgroup with AA Estimate map. It's still largely American and AA in the South, German in the Midwest, Mexican in the SW & Euros in the NE.

19
41
214
Map of the 2022 NY Governor unofficial election night results by the newly adopted NYC City Council districts.
Zeldin won 8/51 NYC CCDs - 15.6%, while winning over 30% of the citywide vote. Zeldin came very close to winning 3 CCDs.

10
46
231
Forget about taking the car keys away from Joe Biden: Somebody needs to take the 13 keys away from Alan Lichtman.
6
23
228
Seattle recall update:
Recall Yes 19,733 50.31 %
Recall No 19,487 49.69 %
15
24
197
Final Round Precinct Winner Map of the 2021 NYC Democratic Mayoral Primary. Adams won it 50.4%-49.6%, largely due to strength in African-American, Hispanic and some Asian and Orthodox Jewish neighborhoods.
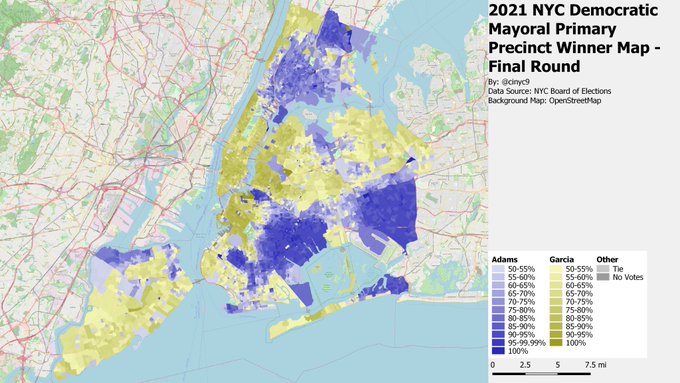
18
57
200
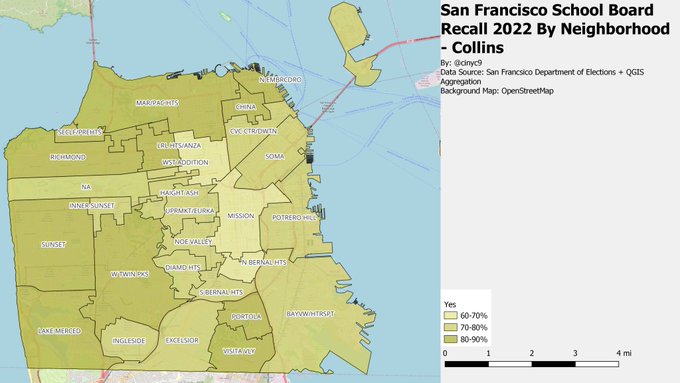
The San Fransisco School Board Collins Recall results by SF Neighborhood Map*. Yes is winning every neighborhood. It's weakest in the Mission District, Western Addition and North Bernal Heights. Not surprisingly Chinatown has one of the highest Yes votes.
5
35
195
Republican
@KristyforNY
Marmorato flipped an East Bronx NYC City Council seat tonight. The precinct winner map.
She cleaned up in traditionally Italian-American areas like Country Club and Throggs Neck, and kept margins down in the more Hispanic parts, too.
@PatrickRuffini

15
51
199
If I said NY held an election where non-Hispanic NYC Asians voted more Republican than non-Hispanic NYC Whites, would you believe me?
A precinct analysis of NYC appears to show this to be the case.

16
46
188
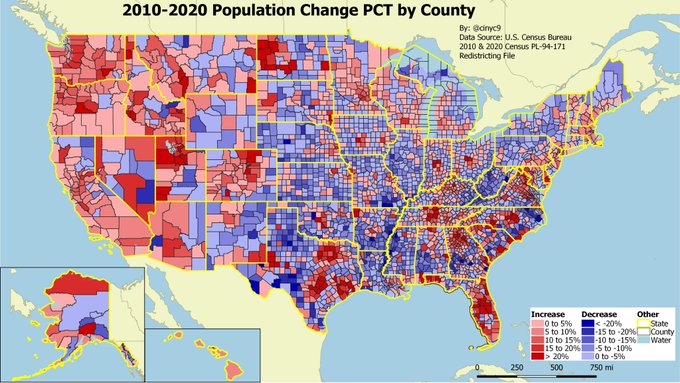
My first Censusmas map is of the PCT Change from 2010 to 2020 by county. Red = pop increase; Blue = pop decrease. It's reddest in the west and metro areas of the South.
18
51
178
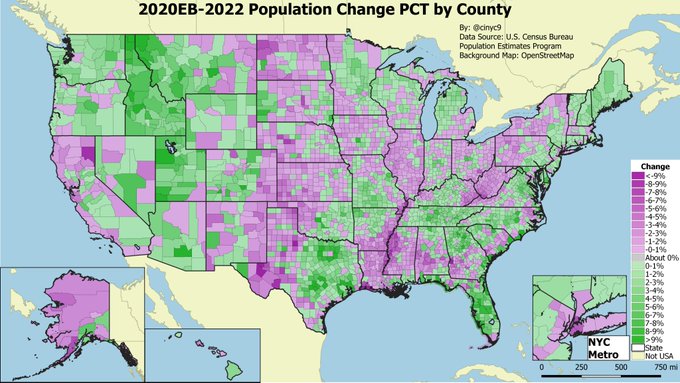
Your 2020-22 County Population Change map. NYC has still lost population on net (though Manhattan rebounded 2021-22 - which will be the next static map before I get thus up as an interactive.)
23
45
176
Map of the unofficial election night NYC results by precinct and new CD.
Zeldin won the new NY-11 and the portion of NY-3 in the city. He also came fairly close to winning Grace Meng's NY-6.
Technical note to follow.

10
38
169
2023 Census Pop estimates are out.
US Pop is 334,914,895 (+1,643,484)
NY lost another 100K residents from 2022-23; California 75K.
11
29
168
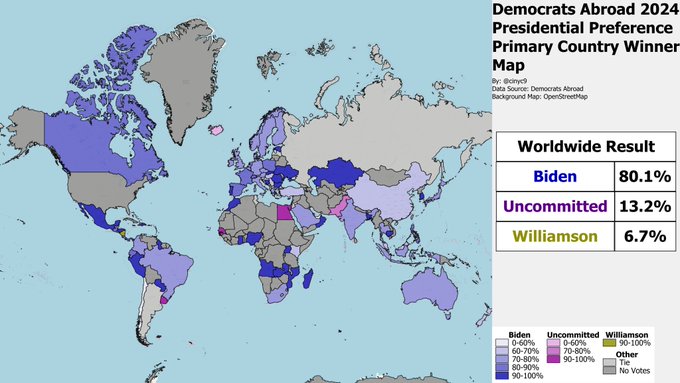
Democrats Abroad cast their Democratic Presidential Preference Primary votes from March 5-12. The traditionally colored country winner map.
President Biden handily won Democrats in most countries, except in some in the Middle East and Uruguay.
10
22
173

@FuckYouGute
This never happened - and you know it.
I will not put up with the bullying nonsense of you or your little clique. Delete this libel now.
8
2
155
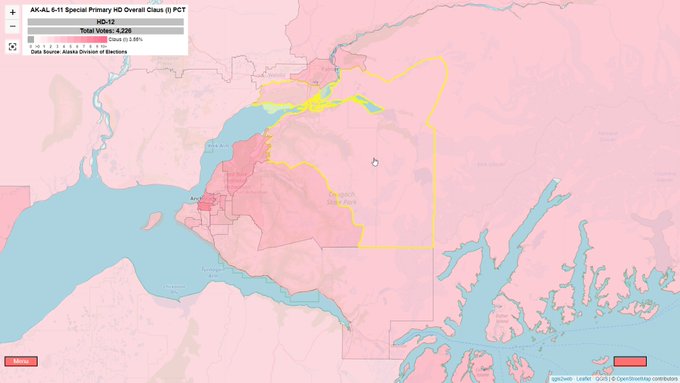
@henryolsenEPPC
There are no 60K seat stadiums in Alaska. Kind of hard to fill one of those up for anything when there are ~400K within an hour's drive.
The Alaska Airlines Center holds 5K. Sullivan Arena holds a bit more (8-9K), but it is being fixed up after being used as a homeless shelter.
0
8
152
A map of the Presidential Straw Poll in Guam. Biden won every municipality. Biden's worst showing was in Mongmong-Toto-Maite near the capital of Hagtna. and areas on the Northern part of the island near Andersen AFB.
I bet nobody else will ever make this map.

2
22
156
Corrected 2PM Rochester City numbers from the Monroe County BoE:
-Total Rochester city: 14.2%
-Total Towns: 24.6%
-Totals: 22.3%
There should be a 5 Alarm fire for the Hochul campaign in the city of Rochester right now.
10
28
156
UK Prediction:
Tomorrow we’ll see the biggest defeat for a British government on July 4th since 1776.
0
18
159
Zeldin took the lead in Nassau, 51-49 with 227,156 ballots now counted there, per the Nassau County BoE website.
Westchester is at 57-43 Hochul with 68,063 ballots counted.
11
28
150
Map of the NYC
@LeeZeldin
- 2020 Trump "swing" on the 2022 precinct map. The redder the precinct, the better Zeldin did vs Trump '20.
The reddest areas were in NE Queens, S Brooklyn and the whitest parts of Bronx.
Overall, Zeldin improved on Trump's 2-party PCT by 7.2 points.

7
31
151
PCT of RVs who have turned out so far, NYC:
-Manhattan 21.72%
-Bronx 11.25%
-Brooklyn 17.35%
-Queens 15.19%
-Staten Island 20.40%
Citywide: 17.02%
(Excludes absentees)
8
45
147
The National Archives will release the full 1950 Census tomorrow.
This is not an April Fools' Joke.
6
11
151
@IsaacDovere
@jomalleydillon
Pres Truman:
The buck stops here.
Pres. Biden:
The buck stops elsewhere.
13
7
152
3D spinning Virginia Locality Winner map, where height = number of votes cast.
6
25
137
@ReturnNormalcy
States I will not be visiting any time soon solely due to politics:
None
Life is more than just politics.
12
7
137
I've finally preliminarily parsed the AK US House and Senate CVRs. Things add up, but still may be off at the edges.
Unlike in the special, had Palin been eliminated, Begich would have lost 55.4-44.6%. This is slightly worse than Palin's 55-45% actual performance.
5
21
143
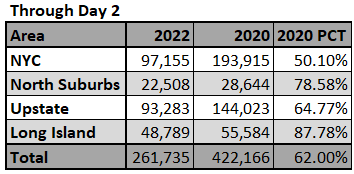
Final cumulative NYS early vote stats by region:
-1,178,674 total Early Vote checkins, ~47% of 2020
-Mid-Hudson, LI are closest to 2020 at over 64%
-NYC signifciantly lags at 38.66%
-Every other region is about at the statewide average

12
32
136
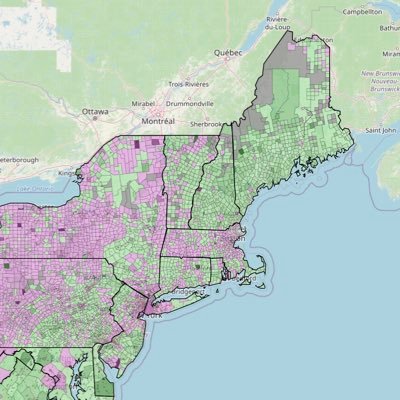
By my back-of-the-envelope calculations, 11.8% of New York Dem voters blanked or overvoted their ballots, largely to protest the Gaza war. The spoilage ranged from almost 25% in Brooklyn to about 3% in Wayne.
Map of spoilage rate by county vs 11.8% SW. Green >11.8; purple <11.8.

8
37
142
London released its ward results today. Here's the map of the in-person first preferences for Mayor WITHOUT allocating the postal votes to wards. That's next, time permitting. The election was really largely an inner vs outer London thing.

6
21
132
Census released its 2021 pop change estimates this morning. Want to see how much your town's population changed from 2020 to 2021? My new interactive is now live map here 👇👇👇👇

10
52
128
Map of the NY Governor's race in NYC by new NYS Senate District (using the election night results in NYC).
@leezeldin
won 5 of the SDs wholly or partially within the city. He barely lost another.
Methodology note to follow.

17
35
131
Wick Insights MI Poll:
Dixon 47.9%
Whitmer 47.1%
Someone else 1.7%
(October 5 - 9; 1,136 likely voters; MoE +/- 2.9)
8
25
124
To the trolls who defamed me by posting fake DMs I never sent last night:
That was a really stupid idea. I have 10K followers, some of them reporters who might be interested shining a light on trolls.
If you don't know what I am talking about read this:

Having integrity is sticking up to your friends and doing what’s right so when I heard my fiend was being wrongly accused of being a pedo I went into action and looked into it the claimed dm crated by the
@socalpopulist
crew and his gc is below now I will prove it’s fake

8
31
119
10
17
124
NYC Checkins as of Noon (Total column includes ED + Early):
RV PCT is % OF CITY
-ED turnout is ~105% of Early.
-Manhattan lags it early votes the most (cannibalism?)
-Bronx turnout is still way below its RVs, even on ED
-Brooklyn, Queens, SI about average citywide PCT of RVs.

7
42
120
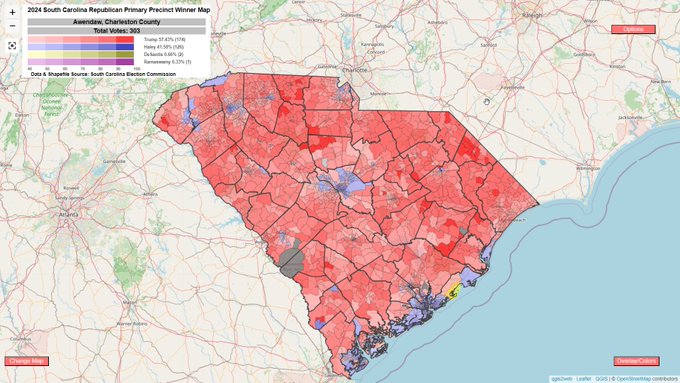
Your final unofficial South Carolina R Pres Primary precinct winner map. Haley won richer, higher educated suburbs. Trump won the rest of the state.
Final unofficial margin of the night is 59.8-39.5%.
Haley won SC-1 and likely SC-6, and will take 3 or 6 delegates to Trump's 44
7
22
120
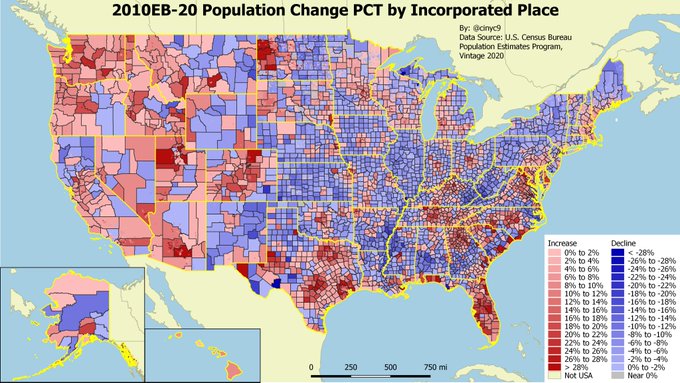
Census released its 7-1-2022 incorporated place population estimates today. Thus, my annual weekend of endless incorporated place population change maps is almost upon us!
For now, here's the static 2020-2022 city population change map. Purple = pop loss; green = gain.

21
40
112
Map of the first round winner in the 2021 Mayoral Primary by new CD. Yang barely won the portion of NY-3 in NYC + NY-5. Wiley won NY-7. Garcia took NY-10 & 12 on Manhattan. Adams won the rest.

5
20
113
Maps of the 2020 and 2022 Democratic NY-16 primaries. Congressman Jamaal Bowman won both primaries, upsetting former Congressman Eliot Engel in 2020, and beating two Westchester County legislators in 2022. Bowman won both contests with ~55%.
The 20 and 22 districts were...
1/3

4
24
120
Top AHR map weekend starts now with the nationwide 2017-21 Top Ancestry or Racial or Hispanic Group by Tract map.
Like in 2015-19 ACS, German is tops in the Midwest, American and African-American in the rural SE & Mexican in the SW.
Interactive here:

17
37
107
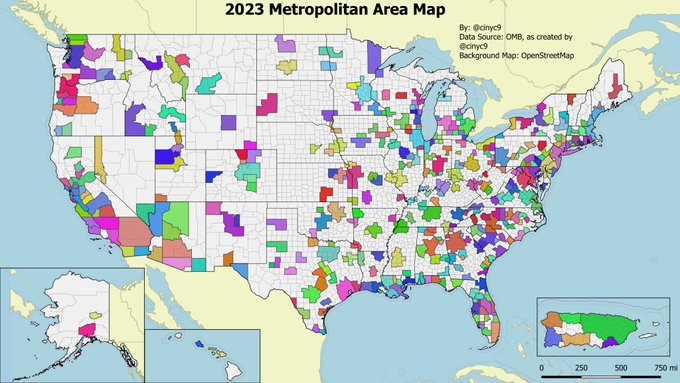
OMB came out with its new Metro Area definitions last Friday.
Preliminary map of the new Metro boundaries (minus the special metros that contain only parts of a county by law).
Caveat: I used Python to "save time" while making it instead of manually merging list. LMK if wrong.
9
22
112
This doesn't exactly add up to the AK DoE tally yet (probably because of I how I tallied overvotes), but a preliminary analysis of the Alaska Cast Vote Record shows that
@NBegich
would have defeated
@MaryPeltola
had
@SarahPalinUSA
ended up in 3rd place by about 8.5K votes.

11
34
112
All 67 of Guam's election day precincts are now reporting. The early vote isn't in.
Trump has ~3.1 K more votes than 2016.
FYI -
@JMilesColeman
12
20
90
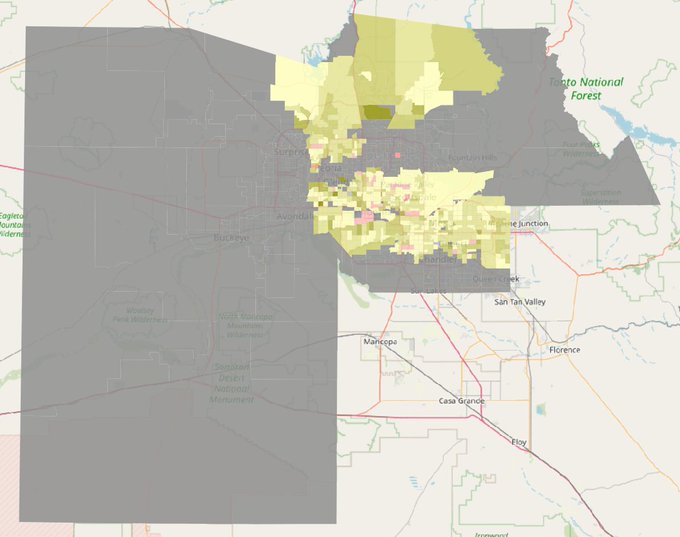
Revised map of what's in of the ELECTION DAY Vote in Maricopa County. A lot of what just dropped was in the northern part of the county, plus some East Valley. It went heavy Lake.
2
19
111
Political analysts should put their partisan affiliation in their Twitter bios.
There is no such thing as non-partisan analysis. Everyone is biased one way or another.
2
8
107
The Democratic map proposal to the Special Master in the NY redistricting case:


26
16
108
Census released its city population estimates last night. I've updated my town population change maps with the new v2019 data. Find out how much your town/unicorporated balance of county grew or shrunk - both vs 2010 & 2018 and each prior year here:

3
32
106
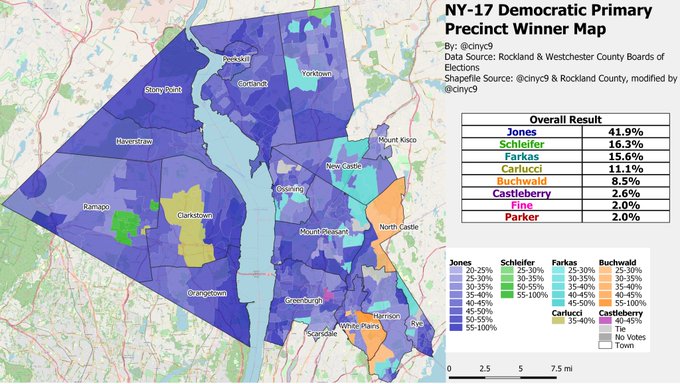
The NY-17 Democratic Primary Precinct Winner Map, now with Official Westchester Results.
@MondaireJones
won the race by about 25%
WC's map was a lot more colorful than Rockland's, due to more & smaller precincts.
Thanks to
@BenJ_Rosenblatt
for getting Westchester's canvass book
2
26
109
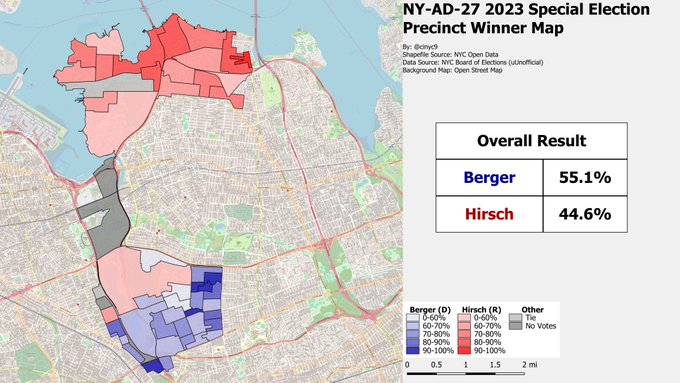
NYC held a special election tonight in NY-AD-27. Democrat Sam Berger defeated Republican David P. Hirsch ~55-45%.
Here's the quick precinct winner map. Hirsch won most of the Whitestone/College Point Precincts; Berger won most precincts in the Southern half of the district.
6
31
106
"Ceasfire" received 3 write-in votes in Boscawen, NH, a suburb of Concord. As a write-in, "Ceasefire" was beaten by Biden (155), Haley (21) and Trump (8) in the D primary.
309 votes were cast there, meaning Ceasefire got <1%.
1
15
107
As you may know, Census released its 2019 County Population Estimates last night. Here's a map of the 2018-19 Percentage Change in US Counties and Equivalents:

9
32
100
Ho ho ho! Maps of
@TheRadicalSanta
Claus' performance in last night's AK-AL special primary election. Santa is currently in 6th.
As the maps show, Mr. Claus did best in Fairbanks (near his North Pole home town) and Dem areas of Anchorage and Juneau.


1
11
104
It turns out, yes, you can empanel a 500-respondent MI Pollfish panel for exactly $475.
However, this includes no screening questions and no meaningful registered voter screen. Yes, the RV box is checked here, but a Yes or No option isn't selected.
4/11

1
2
106
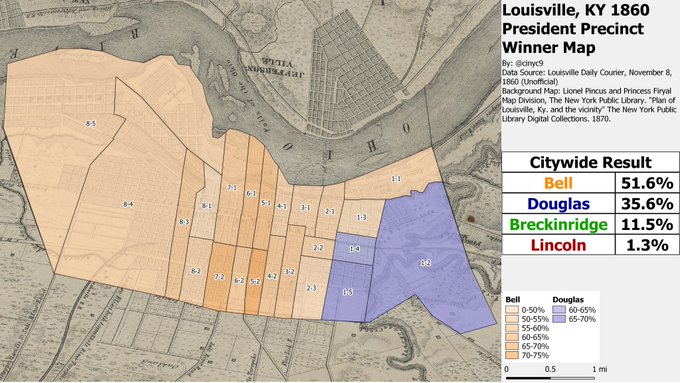
Precinct map of the 1860 Presidential race in Louisville, KY for
#HistoricalElectionWednesday
. Constitutional Union candidate, former Tennessee Senator John Bell, won the city and most of its precincts. Democrat Stephen Douglas took a few 1st Ward precincts. Lincoln came in last.
9
25
97
All the good little boys and girls are in bed right now. But those who aren't (and my Alaskan followers still up) get to see my interactive county 2010-20 population change map by clicking here 👇
2
13
101
Note I said appears. But if I'm right, so usually is Hanlon's Razor - SoCal might not know the mistake they appear to have made here.
Full disclosure: Note that SoCal Populist and I have some past history. They were involved in an attempt to spread fake DMs I never wrote.
11/11
4
1
104
NYC Early Voting Stats through Day 6. The Bronx woke up a little bit today - but not a ton. NYC remains around 35% of its 2020 totals at 246,833 early votes.
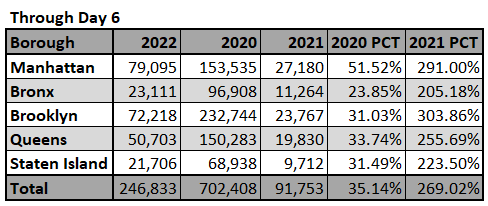
7
23
99
Census released its city pop change data this morning.
Interactive map of the incorporated place (city) and minor civil division (towns with governments) population change from 2020-23.
Default map is 2020-23. Click Menu-->Pop/Num-->22-23, etc for yoy.

7
43
100
@alexweprin
@DrewSav
Are they including concurrent streams? That age group is more likely to stream than watch traditional TV.
3
0
99
Current Noman, OK mayor Breea Clark (D) lost reelection to former Norman safety manager Larry Heikkila (R) yesterday.
Here's a 2D map of Heikkila's victory. Clark won areas near the University of Oklahoma campus. Heikkila won most of the rest.

4
10
88
@MarkLevineNYC
@DustinCzarny
American citizens have a right to return to their country. You can’t force a vax as a condition of returning home. Your order would also condemn citizens living overseas in countries without access to US approved vaccines to never be able to get home.
3
2
94
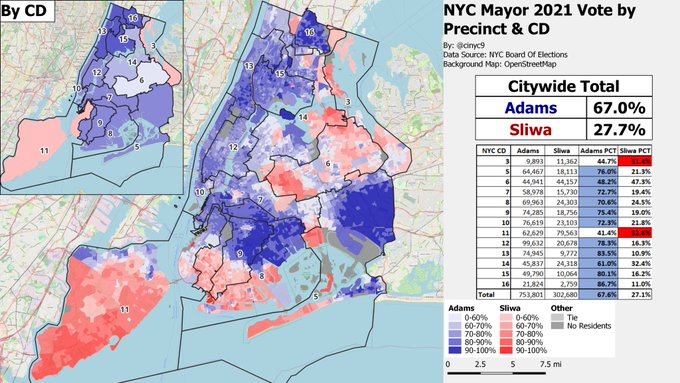
How did
@NYCMayor
Adams and
@CurtisSliwa
perform in the mayor's race under the new Congressional District lines?
As the map shows, Sliwa won new NY-11 and the portion of NY-3 in NYC. NY-6 was very close: Adams won it by less than 1 point.*
5
22
90
Siena College Long Island Poll:
Pres:
Trump 43%
Biden 40%
---
Trump
White 46%
Non-White 35%
Sen:
Someone else 45%
Gillibrand 37%
Generic Congress:
Democrat 42%
Republican 38%
May 13 - 15, 2024 | 504 Long Island Registered Voters | MOE +/- 5.9 points
6
20
97
@tencor_7144
It turns out you can take the night away from Donna Shalala. But Michael Bloomberg will always be a victor of the American Samoa Caucus.
0
1
95
For
#PresidentsDay2022
, a map of the 1864 Election in NYC by ward. General McClellan (D) won the election over Abraham Lincoln 2-1 in the city, which just included Manhattan Island at the time. Lincoln won 1 ward - in Greenwich Village (actually a slight improvement over 1860).

4
20
96
About 125K Democratic absentees have been received by the NYC BoE through today. Here's a 3D spinning map of AD winners so far (from the election night vote), where height = number of absentees received.
As you can see, Garcia-leaning districts have more absentees in than Adams.
4
27
92
Census released its 2022 incorporated place population estimates. I now have an interactive version of this map. The default map is 2020-22 PCT Change. Click the Menu button to toggle between PCT or Numerical change and the years you want to see.

10
29
92
King County, WA released its final precinct results on Wednesday.
Here's the final precinct results map for the City Attorney race. Former Republican LG candidate
@NeighborsForAnn
Davison beat defund police proponent Nicole Thomas-Kennedy by about 4 points.

5
24
91
Census released the July 1, 2020 Incorporated Place population estimates this morning. The nationwide map of changes from the 2010 Estimates base (because direct comparisons to 2010 Census aren't available for new geos, like Chugach Census Area, Alaska).
5
21
89
Area Winner Map of the LA Mayor's race. Caruso won the SF Valley & much of West LA; Bass won Downtown and much of Central LA & Venice Beach.
Note that this was aggregated from the precinct data, joining precinct names to the subprecinct shp - so it could be slightly off.

3
19
91
Ever wonder how
@WilliamFBuckley
fared in his 1965 NYC Mayoral bid?
As the interactive map of the 1965 race shows, Buckley (in orange), running on the Conservative Party line, won quite a few precincts despite only taking 13.4% of the vote.

8
33
93
NYC released a draft 2020s City Council District redistricting map today.
A map of the winner of the first round of the 2021 mayoral primary under the new lines. Adams won 26, Garcia 12, Yang 7 and Wiley 6 proposed CCDs, respectively.

2
21
90
NY Gov (and future VP) Nelson Rockefeller (R) ran for reelection in 1966. He beat his Dem opponent, Queens DA Frank O'Connor, by about 6 points, but was held under 50% because of strong Conservative (Adams) and Liberal (Roosevelt) Party candidates. The town/city winner map:

5
25
91
VA Beach is one of the few VA localities that reports election day checkins. A gif of VA Beach turnout as of about 9AM (EV + ED). Citywide, 16.8% of RVs have voted - about 34% of the 2021 vote.
It appears relative turnout is generally higher in Youngkin-voting areas - but this
5
17
87
@BruceThompson51
@KristenClarkeJD
Asians. Stuyvesant was 6% Asian in 1970, 50% in 1994 and 70ish% today. The white percentage dropped significantly from nearly 80% to around 20% today.
NYC's Asian population also has significantly grown over that period to over 1,000,000. Asians are now 14% of NYC's pop.
5
11
72
Now that I have data for all 62 counties, here's some aggregate early vote statistics for NYS:
First, 2022 turnout vs 2020. It's most down in NYS, and most up on Long Island vs 2022.
10
23
85
Welcome to the weekend of never-ending town population change maps!
Census released its 2022 incorporated placepop estimates on Thursday, so here comes a cartographic cavalcade.
First, the nationwide 2020-22, 2020-21 and 2021-22 town pop change gif. S & W generally gained.
8
22
87
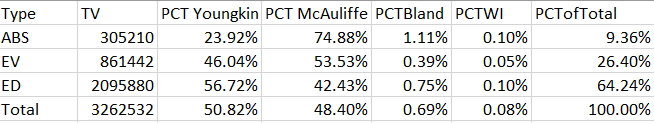
A tale of three VA electorates:
Mail: 74.9% McAuliffe
Early: 53.5% McAuliffe
Election Day: 56.72% Youngkin
Luckily for Youngkin, ~64.2% of the vote in so far was cast on election day.
2
16
86

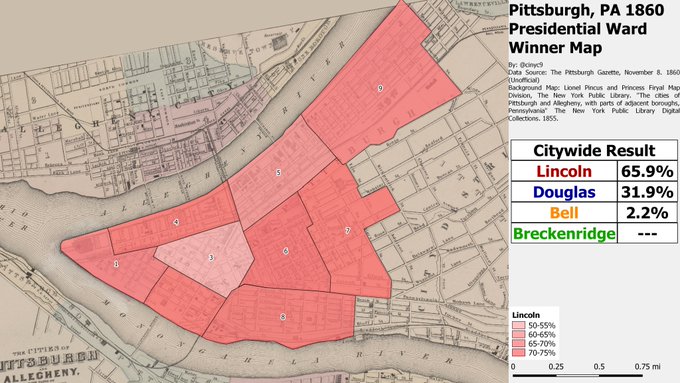
Map of the 1860 Presidential Election Results by Ward in Pittsburgh, PA. Abraham Lincoln won every ward - but not every precinct (2 of the 9 wards had 2 precincts; the rest had 1). I haven't found any precinct descriptions yet, so I can't map that.
FYI -
@DavidBurhenn
@4st8
8
16
88
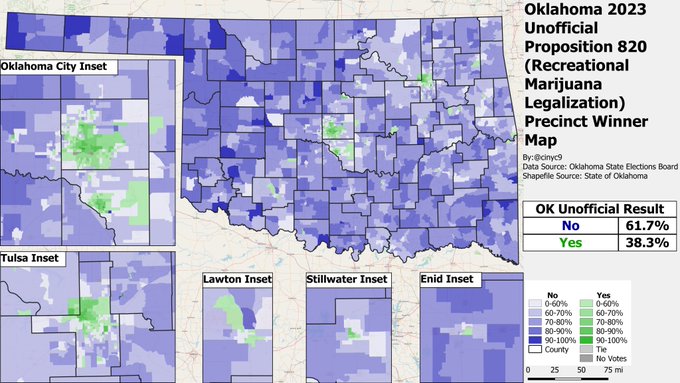
With all precincts now reporting, OK Prop 820 has failed. Thus, recreational marijuana will not be legalized in the state.
Here's the precinct winner map, with city insets:
4
20
84
My interactive map of the 2020 incorporated place population change estimates is now live here:
1
14
86