

Benjamin Td
@_benjamintd
Followers
5,454
Following
1,170
Media
231
Statuses
1,358
Software Engineer. Making , , , , . Maps, data, products.
Paris, France
Joined July 2016
Don't wanna be here?
Send us removal request.
Explore trending content on Musk Viewer
FEMA
• 1237577 Tweets
Liz Cheney
• 242214 Tweets
#LISAxMoonlitFloor
• 236539 Tweets
MOONLIT FLOOR OUT NOW
• 174165 Tweets
Mets
• 134863 Tweets
Bruce
• 98308 Tweets
Happy Anniversary
• 66384 Tweets
Baker
• 55874 Tweets
Brewers
• 53481 Tweets
Pete Alonso
• 36989 Tweets
天使の日
• 36840 Tweets
Falcons
• 33621 Tweets
Saint Dr MSG
• 31991 Tweets
Mancuso
• 31062 Tweets
Halle
• 27614 Tweets
Reds
• 24008 Tweets
#BakeOffFamosos
• 21300 Tweets
Suárez
• 21119 Tweets
Phillies
• 19181 Tweets
gaston
• 18583 Tweets
Bucs
• 18219 Tweets
Bijan
• 16720 Tweets
SAFE FLIGHT JESBIBLE
• 16651 Tweets
Tito
• 16341 Tweets
Mike Evans
• 15211 Tweets
Mooney
• 13887 Tweets
#ゴンチャのハロウィン準備中
• 12614 Tweets
Milwaukee
• 11938 Tweets
#BakeOffArgentina
• 11897 Tweets
Spiritual Awakening
• 10540 Tweets
Quintana
• 10424 Tweets


Pinned Tweet

🚄 Where can you go by train in Europe - 8h edition!
I made an update to , with configurable travel times from 1-8h, and more frequent data updates.
64
674
4K
Isochrones 😍 ! This map shows you how far a 5h train ride will take you, departing from any city in Europe.
Inspired by Direkt Bahn Guru by
@juliustens
.
769
11K
56K
Si vous partez en train de ces villes aujourd'hui à 10h, jusqu'où pouvez-vous voyager avant 16h ?
L'API
#digitalsncf
(construite par
@navitia
) nous répond grâce à ses isochrones.
Notebook à explorer ici:
53
516
2K
I'm turning Chronotrains into a trip planning tool. Think Google Flights, but for trains in Europe.
Because 🚆 are cooler than ✈️.
40
306
2K
🚇 There are 416 London tube stations.
How many do you think you can name from memory?

152
313
2K
Il y a 309 stations de métro à Paris. Combien pensez-vous pouvoir en citer de tête ? 🚇
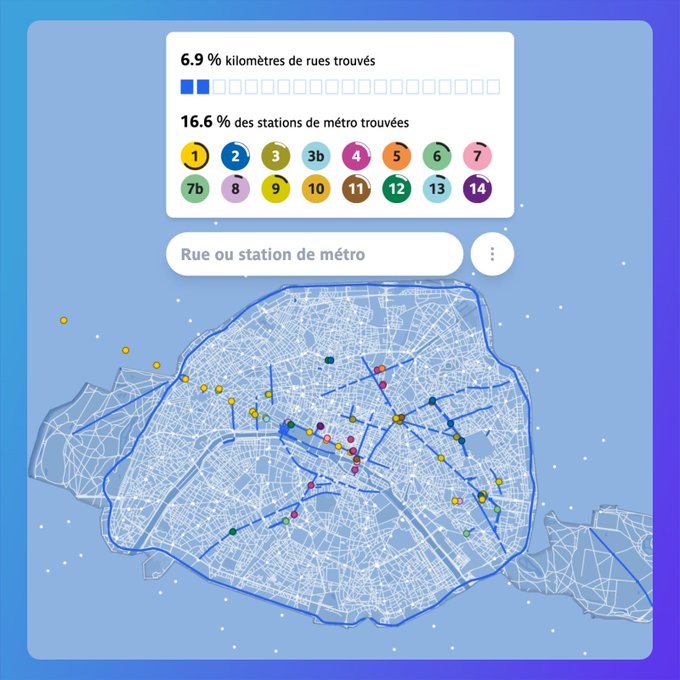
168
379
2K
You can see the discrepancies in access to rail mobility between cities, how certain high-speed connections are favored, how certain cities are isolated...


14
91
957
A researcher from Cambridge,
@AlexisLitvine
, gave me access to train travel times from 1911.
Here's a comparison between now and then - a denser network with more small stations and no high-speed rail.
Their project
@ACommunes
reconstitutes historical networks.
Links below ⬇
9
116
507
Pour ceux qui ne veulent pas remplir leurs informations à chaque attestation, j'ai fait ce site mobile à partir du code open-source du ministère pour en générer en un seul clic:
49
227
490
Over the last months, I've made a lot of small improvements to the tool I built to replace Google Maps:
- Mapillary integration
- Better map style
- More consistent theming
It's now called , come check it out !
36
113
483
The data comes from , which sources it from
@DB_Bahn
.
It gives us the direct trains from any station in Europe (as long as it's reacheable from Germany).
From this we can build a graph of stations with travel durations between them.
13
38
323
I open-sourced Chronotrains:
There's still some cleaning-up to do, but better now than never!

10
58
313
Verdict des coiffeurs avec des noms rigolos.
Les blagues en "Hair" l'emportent avec un énorme 60%, suivies, évidemment, par les "Tif" (28%).
Belle densité dans les Hauts-de-France ainsi que la côte d'Azur.


12
69
315
This is a followup to this tweet:
where I used the isochrones provided by
@navitia
/
@GroupeSNCF
. Here the methodology is a bit different.
Si vous partez en train de ces villes aujourd'hui à 10h, jusqu'où pouvez-vous voyager avant 16h ?
L'API
#digitalsncf
(construite par
@navitia
) nous répond grâce à ses isochrones.
Notebook à explorer ici:
53
516
2K
1
40
296

Une autre petite viz de
@Paris
: L'ensemble de l'éclairage public disponible en Open Data.
J'ai tenté d'obtenir le rendu le plus proche de la vue satellite de la NASA (à droite).
Quelques mots sur la réalisation ⬇️


9
86
214
You can do this with and your Google location history.
Here's mine.


4
17
215
Since walking and local transit options are not included, we add some connections to the graph to account for buses, walking, biking...
For instance, you can easily walk from Paris Gare de l'Est to Gare du Nord in a few minutes.
1
8
187
Every single
@ParisMarathon
finisher on a map!
Made with
@SRHM2
with split time data from 41,700 finishers. 🏁🏃♀️🏃🏽♂️💨
#parisMarathon
#madeWithMapbox
7
67
192
Adding the assumption that interchanges / connections are 20 minutes, we can see all the stations that a reachable from a given city in 5h.
(since there is no guarantee that trains will connect perfectly, the map tends to be overly optimistic)
18
8
182
@JulesGrandin
Celle-ci m'avait matrixé aussi. Le Groenland est à la fois plus à l'Est, à l'Ouest, au Sud, et au Nord que l'Islande.

12
6
184
🚆New in Chronotrains: the suggestions now show the actual rail path to destination, along with the fastest itinerary.

4
10
162

13
53
155
What hospitals can you reach in 45 minutes driving? What about 30 or 15 min?
Fun weekend project with OSM data and the Mapbox isochrones API.
2
32
115
Paris bat au rythme des cyclistes : on compte jusqu'à 3x plus de vélotaffeurs sur les pistes depuis la grève. 🚲
Merci à
@opendataParis
d'avoir ouvert les données des compteurs !
6
29
108
Mapbox traffic slowing down on the path of the eclipse last week (color: average speed in the pixel * frame)
#Eclipse2017
0
54
98

I updated the data for chronotrains, including (finally!) the Paris Eurostar, missing stations (e.g. Millau), and many other schedules that I missed in the original dataset.
Anything you still see missing? Let me know!


10
9
93
La première dataviz du site: .
Une visualisation du trafic mesuré par
@Paris
au mois de juin 2019.
On y voit le volume de voitures (épaisseur) et la densité du trafic (couleur - violet = bouchons).
On y voit des choses intéressantes!
3
35
86
here's a prototype built with my
@googlemaps
location history,
@Uber
's h3, tippecanoe and mapbox-gl. The hex-bin style is a great idea
@robhawkes
🤩


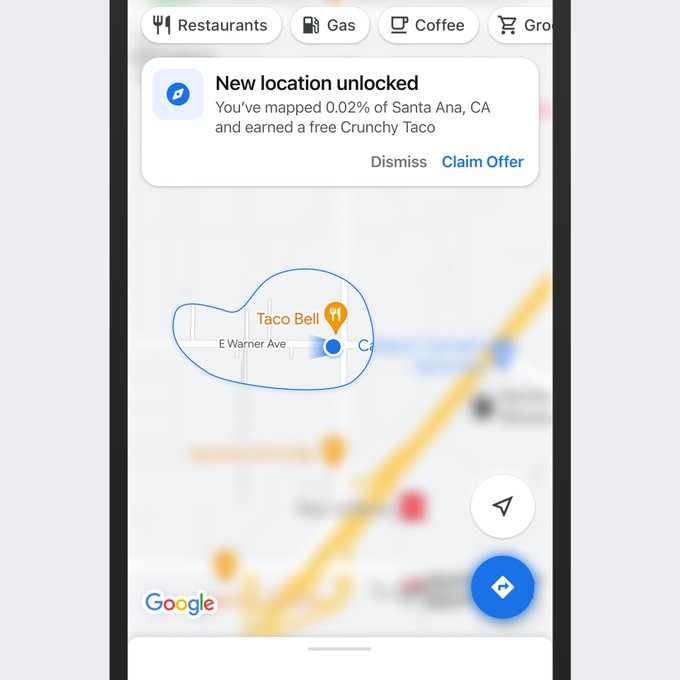
Working on a silly idea for creating custom "fog of war" maps of places you've visited.
The idea is that you can see the areas you've *not* visited so you can explore somewhere new next time. Heavily inspired by strategy games like Civilization 6.
Proof of concept in QGIS 👇

21
38
443
2
9
89
A daily map-based puzzle game where you try to find a city based on satellite images:
After each try, the map unzooms - letting you explore more area.
Can you guess this city from above?

7
21
88
🚇 Hay 276 estaciones en el Metro de Madrid.
¿Cuántas crees que puedes nombrar de memoria?

8
23
86
That's the coolest thing i've seen on a
@Mapbox
map so far - live radar overlay by
@batmansmk
⛴
2
16
84
I spent the last weekends building Data Pour Paris, a collection of dataviz for the city:
Check out:
- 🚗 the city's traffic patterns
- 🚃 all trains & metro, live
- 💡 every single public lightbulb
- 🏃♀️ all finishers of the Paris Marathon
and more!


5
41
80
Hi ha 211 estacions de metro i tramvia a Barcelona.
Quantes pots anomenar de memòria?

3
13
78
here's the live map of the hospital accessibility (by car) in France. Aside from the mountains, there are empty spots in Médoc and Champagne (Sézanne). My guess is that winemakers don't get sick.

4
35
75
Playing with
@Mapbox
GL JS v0.26 -> map of median revenue in France. Funny how Paris and the Swiss border stand out.
#CarteBlanche

2
30
73
🚇 En la Ciudad de México hay 195 estaciones de metro.
¿Cuántas crees que puedes nombrar de memoria?
¡Pon a prueba tus conocimientos y diviértete con nuestro juego!
🔗
#MetroCDMX
#JuegoDeMemoria
#CDMX

1
10
74
Une carte de Paris pensée pour les piétons et les vélos:
- 🔸 Pistes, bandes, double-sens cyclables (dont les coronapistes)
- 🍏 Rues aménagées pour les piétons et zones d'intérêt à la Google Maps
- ⚓️ Basée sur l'open-data de Paris

4
26
70
Berlin! 🐻
Es gibt insgesamt 310 U- und S-Bahn Stationen in der Stadt. Wie viele davon könnt ihr aus dem Kopf aufzählen?

8
10
67
@BorisMericskay
J'avais fait cet outil en ligne, je ne sais pas si ça marche toujours avec les exports récents

1
3
63
Inspired by this tweet, I made a little app that shows OSM edits in near real time:
Of course I had to use the latest
@Mapbox
beta 🌍
5
11
64
Deuxième visualisation:
Plutôt relaxant de voir se coordonner le transport en commun Parisien (ici en x10).
Petit thread sur la méthodologie !
6
25
63
The MapTiler tool I used to see tile boundaries and addresses is down due to unpaid Google Maps subscription - so I made a quick replacement: .
Find a quadkey or tile address quickly, and copy it to the clipboard with a single click!
0
15
59
Can you name all the stations on a blank NY Subway map?
This one is hard (once you run out of numbered streets to type).

15
5
58
The DC Metro has 98 stations.
How many of them can you name from memory?
I visited twice with
@mapbox
but couldn't score more than 20% 😅

9
5
59
🚄 From Hamburg, Germany, 12h in trains will take you to Montpellier 🇫🇷, Budapest 🇭🇺, Plymouth 🇬🇧.
What other cities would you like to see animated like this? Tweet back and I'll reply with the video.
20
10
58
Today is my last day
@Mapbox
. It's been great working alongside so many talented and curious people. I'll be joining Shone, helping to make cargo ships autonomous! ⛴
7
1
54
@grains_truth
@xruiztru
I'm working on a data update, I got a problem with the Eurostar indeed
1
0
50

@JackMaizels
@GarethDennis
@juliustens
Yes, I've gotten this suggestion from
@GarethDennis
as well, might give it a try !

@_benjamintd
Could you now create a heat map showing best/worst connected places in Europe? That would be ace. But also: I'm definitely doing a
#RailNatter
where I just tour about in this!
1
1
16
2
1
46
I've made a few adjustments to the Scratch Map, a fog-of-war map of all the places you've been, according to your Google location history.
Here's the link, if you want to try it out and give me some feedback !
1
12
48
Obligatory link slap :
3
5
46
I've used plenty of bike shares before, but
@jumpbikes
really stands out.
- The bikes feel safe and sturdy
- Dockless, yet you can only attach them to bike racks (ie city infrastructure)
- Electric assist makes you faster than a car in many situations
- Bonus, they use Mapbox :)
1
6
41
Here's where traveling 12h by train from Munich takes you.

1
4
41
I'm soon going to have to pay my first
@Mapbox
invoice 🥲
Unfortunately 5$/1000 visits is unsustainable for an ad-supported website.
Thinking of moving to Maplibre. What's a cheap way to serve a simple background map?
Frequent updates and detail at high zooms unnecessary.
22
6
37
Restauroulette: let a silly website chose where you eat, when you don't want to.
3
5
40
chronotrains had over a million visits and around 80 million isochrones requests in the past couple weeks.
thankfully, after some help from
@vercel
to get the infrastructure right on launch day, I never had to think about load, response times, etc.
2
1
37
The original viz is still making the rounds :)

An isochrone map depicts the area accessible from a point within a certain time threshold.
This map shows you how far a 5h train ride will take you, departing from any city in Europe.
[interactive map: ]
102
825
7K
3
1
34
@AghiadHaloul
@juliustens
I'll open source after some cleanup, thanks for the idea, it's definitely in my to-do ;)
0
0
31
On entend beaucoup parler de
#DansMaRue
depuis le
#79inter
de
@Anne_Hidalgo
.
Visualisez son utilisation depuis son lancement en 2012:
Quelques observations en thread ⬇️

3
18
32
@ayoungmanriver
@juliustens
I'll clean it up before open-sourcing. The geometries are pre-computed for hours 1-5, I could do more but I need to find a way to make it compute faster :)
How far in time would you like to see ?
5
1
27
Five minutes of live metros in Paris on Dec 3, sped up 8x.
Data: Île-de-France Mobilités (live API)
#OpenData
0
7
31
Wien gewinnt die Umfrage!
Können sie alle U-Bahn-Stationen in der Stadt aufzählen?

A few cities have been requested for Metro Memory! Which ones should we do next?
(Other: please reply below!)
20
1
14
7
3
32
Voici la petite viz que
@SRHM2
et moi avions faite après le Marathon de Paris l'année dernière.
Je l'ai réadaptée pour la mettre ici :
Voici comment⬇️
2
8
32
12h in trains from Prague take you to 🇳🇱🇫🇷🇱🇺🇧🇪🇩🇪🇮🇹🇭🇺🇷🇴🇺🇦🇦🇹🇨🇭🇩🇰🇵🇱🇸🇮🇨🇿 (flags in no particular order except trying to confusingly alternate horizontal and vertical stripes)

1
2
32
🚞 half a day in trains from Geneva will take you to Vienna 🇦🇹, Edinburgh 🏴, Valencia 🇪🇸.
1
4
30
Twitter level unlocked: Massimo.
An isochrone map depicts the area accessible from a point within a certain time threshold.
This map shows you how far a 5h train ride will take you, departing from any city in Europe.
[interactive map: ]
60
684
6K
0
0
30
@Calavian
C'est normalement sauvegardé dans ton navigateur mais je peux rajouter une fonction d'export en plus :)
3
0
29
Damn, data processing on
@felt
is ✨fast.
Drag and drop any GIS format of any size and it'll just pop ready in a minute.
Tippecanoe's doing the magic I guess.
2
3
27
Ça fait 220+ jours cumulés passés sur , il y a plus de geeks du métro que je ne pensais 🤯.

0
2
27
J'ai été interviewé par
@OuestFrance
au sujet des déserts ferroviaires en France.
À ce propos, voici une carte qui illustre les zones dont il est le plus difficile de sortir en train, en métropole.


1
2
27
We've released the beta version of our video export feature on
@PelicaLabs
. It's a beta in a beta. Betaception. We're looking for feedback if you want to map a run, a trip, or just a nice location :) -->
0
4
25
Very proud of having my map forwarded twenty times to Tom. Thanks for the shootout.

Very proud of my personal brand now as about the twentieth person forwards me the European rail network isochrones. (which are amazing).
1
0
21
1
0
22
The Horizon Explorer app is everything I wish I had on hikes earlier
#MadeWithUnity
#madeWithMapbox
0
4
23
at first I thought it was a
@brnkhy
tweet

Obsessed with these low-angle satellite images from
@planetlabs
1: Doha, Qatar. November 11, 2017
2: Houston, Texas. March 14, 2018
3: Riyadh, Saudi Arabia. March 10, 2018
4: Osaka, Japan. March 13, 2018


14
413
1K
1
3
23
My first
@mapbox
map was a lane-level map of a highway in the Bay Area, a few days after meeting
@morganherlocker
and
@lxbarth
. Time flies!
#1millionexploring

0
3
22
@botic
@oler
@juliustens
You can see any station when zooming in, my mouse just happened to hover over this one :)
I tried ordering the stations somehow but sometimes you'll need to zoom in a little.
I'll try adding a search bar next.
1
0
19
@juanleitonm
@juliustens
it's a next.js app hosted on
@vercel
with a database on
@supabase
.
Quite a bit of pre-processing to compute the isochrones beforehand.
Mapbox-gl-js is doing the work on the front-end. Client-side caching with vercel/swr, server-side caching with
@vercel
's built-in cache.
4
1
20
Lisbon is... disappointing in comparison 😅 Leaving Portugal by train takes a while!
But you can get to Barcelona in 12h 🏖️ if you think the Atlantic is too cold.

3
2
20
Parisiens, si vous cherchez où boire des coups ce soir, cette carte vélo/piétons recense les zones les plus denses en terrasses éphémères (en bleu) -

2
3
21


The new Mapbox Standard style is top notch cartography + data. Look at those lighting details ✨

0
0
20
Great piece by the NY Times.
I'm lucky to have worked with people like
@morganherlocker
with strong values on privacy. With location data, privacy is the product - the added value is storing as little data as needed to derive insight.
1
4
18
I'm currently completely misusing Mapbox Studio to visualize non-geographic data and I love it. ✌️
1
0
17
Splitting work across servers according to telemetry volumes. Want to help us build great data pipelines?
0
3
17

Most maps have hierarchies that favor major roads (in a car-centric view).
What would a map that's designed for pedestrian and bikes look like?
1
3
17
It's all cached at the edge thanks to the Vercel CDN. The base map is also super fast with the tiles hosted at
@Mapbox
.
the interactions feel as fast as when developing locally, that's insane.
4
0
17

1
5
17