
TheChartist
@YTTheChartist
Followers
584
Following
1
Media
2,183
Statuses
2,713
I see patterns in everything. I am coming to change the world. And, I will. With God by my side.
Moon
Joined September 2023
Don't wanna be here?
Send us removal request.
Explore trending content on Musk Viewer
taylor
• 276018 Tweets
Jesus is Lord
• 135940 Tweets
River
• 115000 Tweets
#MiamiTSTheErasTour
• 105141 Tweets
#SmackDown
• 64537 Tweets
自民党本部
• 44949 Tweets
Botafogo
• 37425 Tweets
首相官邸
• 36664 Tweets
Duke
• 33922 Tweets
Undertaker
• 28660 Tweets
STREAM PARTY EXPRESS
• 27626 Tweets
GALA EN HAVEN
• 25174 Tweets
Florida State
• 16973 Tweets
Nacho
• 15623 Tweets
Cruzeiro
• 14258 Tweets
NEW REP BODYSUIT
• 14070 Tweets
Jey Uso
• 12490 Tweets
Motor City Machine Guns
• 12364 Tweets
eleanor
• 11307 Tweets
MCMG
• 10772 Tweets


Pinned Tweet

I take charting requests gleefully. If you have anything you want charted, feel free to let me know what ticker symbol you want.

21
1
16

And with that $NKLA closes over $1.00! Congratulations investors. What a memorable week this was. I can't wait for next. Market is closed tomorrow so enjoy your weekend.
3
5
55
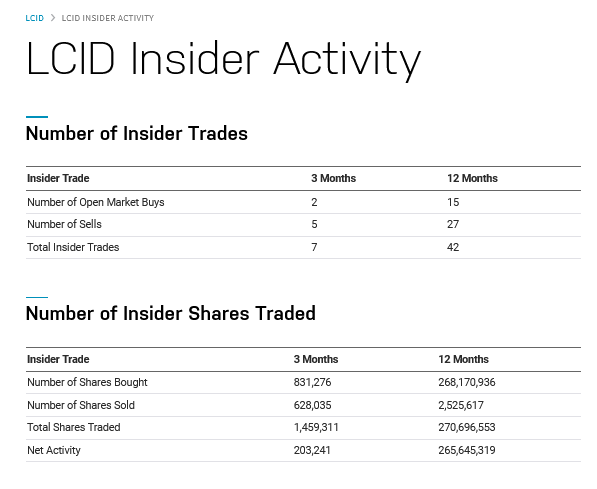
$LCID insider trading on NASDAQ shows a whopping 268,170,936 shares bought and only 2,525,617 shares sold over the last 12mo. That is another level of leadership confidence.
4
11
55
Ripped from reddit, it appears as though another major catalyst has appeared for $NKLA. Notice the article highlighted Nikola trucks. 😎
Monday could be spectacular. 🍿

0
1
42

If $NKLA continues climbing, we could see two squeezes take place. A Short and Gamma.

3
4
36
Obviously $NKLA is having a battle to break $1.04. We wait. Still.

1
3
32
The algo targets keep rolling in on $NKLA . New 5m candle target has appeared for .8966. 🍿

6
3
29
A new $NKLA 1hr candle algo target has populated just now with a price tag of $1.16.
Let's see what happens. 🍿

Good Morning $NKLA investors. The first bit of information I want to pass along is that in pre-market trading a 2hr chart algo target has spawned for $1.06 to reinforce the 15m chart for the same price. We could see it run there today. Fingers crossed. 🍿


0
2
17
2
4
25
Algo targets are pouring in. Too many to post. $NKLA is going to keep going up. 😎
1
2
25
I am going to put forward a ticker I believe to be extremely undervalued. Ticker symbol $FSR.
@FiskerInc
They have a great balance sheet, Over $500m cash on hand & a great product that will be ramping up in 2024. I believe 2/22 earnings to be bullish.

1
2
26
A review of ticker symbol $HOLO shows the ticker is approaching the descending support trend on the daily. The previous touch saw a short squeeze of 6461.54%. Notable resistance levels are 3.90 and 15.90. We could see a break by 21 June.


1
6
24
To put into perspective exactly what we could be about to witness with $AMC, on the 2d chart AMC is trading in a Descending Broadening Wedge since it surged in 2021. Using the proper measurement, the setup has a value of over $3,300 regardless of break point.
Please see charts.


A review of $AMC shows the ticker is in a rather tight consolidation on the 1hr chart. It appears to be highly compressed and could explode any time. It is a symmetrical triangle and could break either way. As an optimist, I will be choosing September monthly calls.

0
0
8
4
4
23
Checking back in on ticker symbol $NKLA 1hr chart, I believe what we are seeing form is a bull pennant. This is a continuation pattern. The due date of the setup is 4/16. If we get a confirmed bounce, and not a break down on the bottom trend, that is an entry point.


2
2
21
Big volume stacking up right here on $NKLA

Something has changed on the way $NKLA is trading. Take note of the candles.

1
0
6
1
1
17
A review of ticker symbol $NKLA on the weekly reveals that I was incorrect. The ticker is attempting to break back into a channel it broke below. I do believe however that it is about to run.
Please see chart for more information.


3
2
17
Something interesting about ticker symbol $LCID is that all trend lines point to one place in time. 02/26 earnings.

3
3
18
If we look at $GME on the weekly chart, we can see where the shorts broke trend and forced the ticker down starting in 2016. The retail trader movement that was initiated by Roaring Kitty forced the ticker back above trend. I believe $GME should bounce off of that same trend.


1
1
19

Additional consideration for $AMC is that when Bollinger bands are narrow due to low volatility, they are often a sign that a ticker is "coiling." This consolidation period can be a precursor to a significant price movement because the market is gathering energy for a breakout.

3
1
19
Some news relevant to $NKLA investors 🍿

0
1
17
Should $GME continue to fall, I expect a bounce to come at approximately $19.14. This could be the final touch of trend before it begins to ascend.


1
1
19
Good Morning $NKLA investors. The first bit of information I want to pass along is that in pre-market trading a 2hr chart algo target has spawned for $1.06 to reinforce the 15m chart for the same price. We could see it run there today. Fingers crossed. 🍿
0
2
17
$NKLA has another new algo target that just spawned on the 15m chart for $1.06. 🍿

The algo targets keep rolling in on $NKLA . New 5m candle target has appeared for .8966. 🍿
6
3
29
0
2
18
Today we got what we've been hunting for months now. The touch of the descending support trend line on $NVAX. Consideration must be given to the white trend line and a potential liquidity grab taking the ticker to it. Either way, it is looking better and better.


3
3
18
And with that $NKLA closes up 12.19% on the day. What a ride thus far. 😎

0
0
16

$GME is starting to break trend on the 10m chart. Keep in mind we will probably see a small run followed by a return to broken trend before it continues it's ascent.

1
0
16
I think I found why $NKLA rejected so hard today when it ran to .9440.
It met the descending resistance trend line that has ensured the ticker stays under water for the last 4 years.
This is the true test of the stock. To break this trend line means everything.

3
3
13
$NKLA wedge is breaking out. Off we go.

$NKLA appears to be making a falling broadening wedge on the 15s.


0
0
3
2
3
13
Ticker symbol $LCID is trading at 3.78 in premarket. I expect a bounce to be forthcoming at approximately $3.65 at open if it continues to come down. This could be the touch back we have been scouting. I am more inclined to believe the 11th is the day. Let's see what happens.


1
1
13
A review of $TLRY shows the ticker has an NAV of $3.91. The ticker is trading @ $1.71. A 56.2% undervaluation heading into 10/10 earnings. If they continue to improve revenue growth, margins, & ultimately its cash flow & profitability, we should see a return to trend curve top.

0
0
13
Ticker symbol $DJT is approaching trend at approximately $19.16. It is shaping up to go on a run starting early next week.
If trend should break down, I suspect it will run to $17.31 to gap fill, then run right back above trend.


5
0
12
$NKLA blew right by the 4 year trend line that it rejected off of so hard yesterday. 😎
Now, what we want is to see the trend being used as support instead of the resistance that has kept the ticker underwater for the last 4 years.

5
1
12
The $NKLA weekly candle algo target is well on it's way. 🍿
Keep in mind it does not mean it fills in a week. Although it can, it is not certain it goes straight there.


0
1
13

New algo target appeared on the 15s chart for $NKLA 🍿
Let's see what happens.

2
0
13
A review of ticker symbol $ACHR 1hr chart shows the ticker is just about done consolidating on trend. We could see the ticker break out by the due date of 10/7.
The pending move appears to be approximately 49.34%.

1
5
12
An observation regarding the descending resistance trend line on $NKLA we are waiting for a break of, is that the previous rejections were, without exception, decisive. This time appears to be different. 🍿

A closeup of the approximate price we need to see $NKLA break above in the moment.

0
0
1
2
0
13
Checking in on $IONQ we see the ticker is breaking away from resistance. I can't emphasize enough how important this stock will become in the future. For starters, quantum algorithms will speed up the learning process for AI agents allowing agents to learn & adapt faster.

0
3
12
Checking different time frames for $NKLA algo targets, this one just popped up today for the WEEKLY candle.
😳

1
2
12
$NKLA leadership killed the rally? Strange timing to announce this on the day the stock appeared it was going to hit the 2nd leg of a rally.

DJ
#Nikola
Wants to
#Reduce
Its
#ShareCount
-- Market Talk $NKLA
Dumbest idea ever as you can see from the share price action... attract more
#investors
, don't shoot your
#shareholders
. HELL NO!

6
1
19
7
2
12
Left out the most important piece of the $AMC puzzle on this post. Apologies. Please see chart below.

An explanation regarding $AMC price action since the 2021 surge, which broke the trend curve, & similarly to $DJT: Automated trading systems, guided by neural networks or other models, sought to move the ticker back to its expected range by executing buy & sell orders over time.


0
0
2
0
1
11
I admit I am a bit cynical when it comes to the stock market. I was not aware of this and thanks to my new friend
@SuperStockBull
he taught me something. Thank you for that. 😎$NKLA

@YTTheChartist
The reason you're seeing the barcoding is because we went from trading in 1/10 of a cent increments to one cent increments. That's the difference between stocks under a dollar and stocks over a dollar. $NKLA
2
0
8
2
1
11
Checking in on $ACHR, the ticker is sitting on trend right now and I expect a bounce to come off of it.


2
2
11
$NKLA now using trend as support. 😀


2
1
11
Ticker symbol $DJT is roughly $.20 from gap close. Let's see if we get a bounce back to trend afterwards.

2
0
11
It is looking more and more like we will see a rerun of the 1999 and 2005 H5N1 Avian Flu pandemic. If you do a search for Bird Flu you will see a myriad of videos and articles priming the public for this pandemic. I suspect we may see a breakout of $NVAX soon.


1
2
10
We see $GME is bout to complete a 3-set. I believe we will see it bounce very soon.

Here is a much larger example of mirroring I was talking about.
$AAL 15m chart is at the end of the sequence.


1
0
0
0
1
10
A review of $AMC shows the ticker is in a rather tight consolidation on the 1hr chart. It appears to be highly compressed and could explode any time. It is a symmetrical triangle and could break either way. As an optimist, I will be choosing September monthly calls.
0
0
8
@JessicaNigri
Degeneracy is not a religion. It is nothing more than the brains reward center corrupted by the intake of debauchery. This is why our birth rates are at catastrophic levels, and why morals based on religious principles are under attack. They are the enemy of degeneracy.
0
0
4
Regardless of how ridiculous this may sound, I am putting it out there anyway. $AMC squeeze begins when it breaks the white trend @ approximately $23.32 on the falling broadening wedge. The setup width is 13,857%. This gives us a destination of $3095.74. See chart.


2
1
9
Checking in on ticker symbol $IONQ 1d, we see the ticker broke back above the falling wedge & is trading in a tight channel. If it does not breakout before 11/11 earnings, I believe this to be an incredible opportunity. I expect the ticker to make a 134.01% move once it breaks.

1
1
9
@Vinnegal
With degeneracy rampant in society leading to catastrophic birth rates and the inevitable decline of the species, there won't be any legs left to work if we continue down this path.
0
0
4
One final update on $NKLA after hours trading, there is a buy wall set for .8970

0
2
8


$NVAX is making a series of higher lows and higher highs. We should see the ticker move up about 20-30m before close.
If it continues this pattern into tomorrow, we would see a high of day about $13.30-$13.40 and come back down to trend afterwards.

2
0
9
Trading in the same exact setup as $AMC, $VERV, and others, ticker symbol $PLUG falling broadening wedge has recovered from a liquidity grab in time for earnings Friday morning. I expect them to be bullish.


1
0
6
As I've said before, as $NVAX closes in on the white descending support trend line, keep an eye out for developing pandemic stories.
We may see a rerun of the 1999 and 2005 bird flu pandemic declarations which led to the ticker going parabolic.


2
3
9
We should see a bounce on $AMC right about now. It is sitting on base of curve on the 1hr chart.

0
1
9
Doodling on the $AMC 3hr chart and comparing the bar patterns from the previous run in 2021 to the current one, it appears that if not for the trendline keeping the ticker subdued, it is tracking similarly to how it did before.

0
0
9
Fed documents were released last week confirming that Cannabis be recommended to change from Schedule I to III. The Cannabis ETF, $MSOS appears on the verge of breakout of it's descending broadening wedge as a result of this developing story. See chart for expectations.


0
1
7
$ACHR it's the morning of 10/2. Annnd away we go! 🙂

Checking in on ticker symbol $ACHR we can see on the 5m chart the ticker has broken above resistance and is nearing completion. We should see it begin it's ascent by Wednesday morning 10/02. Target price is approximately $4.57.


0
1
4
2
2
8
$AMC is in a similar situation to $GME. It is also sitting on a rising support trend line right now. As shown before, when $GME moves, $AMC moves in tandem. With $GME mere pennies from a bounce, I expect them both to start moving tomorrow.

2
0
8
My son leading the way with the $AMC TA this morning. He found this falling wedge that is about to breakout. This no doubt is the setup built to break the 4hr trend I believe. Look for a break out then return to trend. A break of the 4hr trend would come around $4.85.

0
1
8
To catch a falling knife. $WBA has been in free fall for 3 years. I believe it is about to bounce. I believe this to be a large version of my broadening theory of mirroring. If nothing else this find is for science.

How you can find bounce points in stocks that are broadening using $IBM as an example. Think of broadening as mirror in mirror imaging like the photo. They almost always come in sets of 3.


0
0
1
1
1
7
$NKLA still bar coding.

Just look at the bar coding taking place on $NKLA that happened as soon as $1.02 was hit. That must be the magic number.

1
0
6
1
0
8
$NKLA got the break.

On the 30s chart $NKLA is trading in an ascending triangle in an uptrend. This is considered a bullish continuation pattern. Let's see if it breaks the .69 level as confirmation. Ultimately that is what counts.


0
0
1
1
1
8
Checking in on $NVAX after hours trading, it appears it got beat down quite a bit. If we look at the chart on the weekly, every single time the ticker had a short squeeze, it came on a touch of the white trend with a pandemic declaration. 11/24 trends intersect.


2
2
8
$DJT has broken the trend line and I suspect it will close the gap at approximately $17.31 then make a return trip to broken trend right after the gap closure.


Ticker symbol $DJT is approaching trend at approximately $19.16. It is shaping up to go on a run starting early next week.
If trend should break down, I suspect it will run to $17.31 to gap fill, then run right back above trend.
5
0
12
0
0
8
Checking in on $BLNK
@BlinkCharging
we can see the ticker is consolidating on a decade + trend line. I believe by years end we will see it break from descending resistance & begin a move of approximately 460.52%. I believe it is likely to start within next 2 earnings. 4hr + 1w.


0
6
8
I got out of a large $NVAX position 3 days ago. If I had held I would have $1.9m today. The luck. 😅

5
1
8
A review of ticker symbol $RIVN 30m chart shows the ticker broke above trend on 9/11 and looks to be about done with consolidation. With the due date of this consolidation phase to end on 9/19, I suspect we will see the ticker breakout tomorrow.

1
0
8
@oralcn
Every sin has one commonality. They are all degenerate in nature. Biblical love is regenerative. Secular love, such as homosexuality, is degenerate. What makes one different from the other? One creates life and the other death of the species. "The wages of sin is death."
4
1
5
Checking in on $ACHR, the ticker is still staging in the large consolidation on trend looking poised for a breakout by 10/3.
With so many tickers in similar situations, a hidden catalyst is coming to make all of these tickers move by the 1st week in October.

0
3
7
A ticker I am watching closely is $NKLA. On the 5m chart, we see that the ticker is approaching a breakout from descending resistance by the due date of 9/18. I believe the absolute bottom is $4.83, which it will likely not reach before breaking out.
5m and 1d charts shown.


0
1
7
Using $NVAX as an example, I'll illustrate how to maximize the potential of a trade by leveraging trendline values and selecting the appropriate contract duration based on the setup's due date.
Please see below chart for explanation.

1
0
7
While doing a bit of research on $NKLA I realized the leadership of
@nikolamotor
inadvertently slowed the breakout move by selling on 3/5, right when the ticker was set to launch. Strange timing.


4
0
7
Ticker symbol $NVAX on the 30s chart looks like it is about to grab a bit of upside as the falling wedge looks complete almost.

0
0
7
With earnings pending for 9/26, $BB looks poised to make a run at a breakout of this weekly candle falling wedge. I will be looking for a break of $2.99.
1w and 1hr charts shown.


0
0
7
A review of the luxury auto maker, $FSR
@FiskerInc
, appears to be at a bounce point on the daily trend. This type of move we have seen on several tickers. And, it appears as though a bounce followed by consolidation is coming.


0
0
6
Checking back in on $CGC, the descending resistance that has kept the ticker underwater for 4 years has not broke. $CGC has not had it's $NKLA moment thus far.
When this trend breaks, for myself, is the single most important moment for the ticker. $14+ when it does break.


1
2
5
Checking in on $BB, we see that the ticker broke below the falling wedge, touched the trend curve on the weekly chart, and then rebounded back into the setup. It is currently about $0.05 from the bottom of the wedge—a potential bargain.

1
2
7
With $CGC breaking out on 4/30 and running to $14.91, those familiar with my TA know almost every break in the market involves a return to broken trend. $CGC has completed that touch back and I believe it will start to recover the lost ground it made on 4/30. very soon.


1
1
7
Checking in on $AMC 1hr chart, I am looking for a bounce @ approximately $4.20

1
0
6
There appears to be a level that $NKLA is fighting to break above. A similar scenario to the one we were waiting for a break on yesterday. This one is approximately .8189. Attaching the 15m chart to show level.

1
1
6
Checking in on $NVAX, the ticker tried 6x to break $4.32 and rejected. If the ticker should succeed in breaking that level, we could see a nice move. Take note of the previous break of $4.32.


0
0
6
A penny stock we may see go ballistic in the not so distant future is ticker symbol $ATER. The stock has been driven down since early 2021 and recently broke above the resistance trend line. The width of the setup is 1472.39%.


1
3
6
The ticker that has my interest piqued is $KOSS on the 1hr chart. We should see it break out by Thursday, the 29th, and begin the next leg up.


0
0
6
An earnings review of $BTBT shows two intersecting trend curves: blue represents resistance, while yellow represents support. Considering the previous earnings beat by over 3,340%, we could see blue trend give way @ $4.28 if earnings exceed expectations again.

1
1
6
A penny stock that I believe is worth taking a look at is $DPRO a drone manufacturer. They completed a new production facility 10 months ago and reported a 30% increase in revenue QoQ. The new facility is paying off.
See more on the chart below.

0
0
6
Checking in on $NVAX we see the ticker is currently touching back on trend on the 1hr chart. It should see a bit of upside heading into tomorrow. A potential swing, or day trade tomorrow.

0
1
6
With such volatility on $FSR
@FiskerInc
I decided to see what the short interest is on the ticker. Out of 198.19m public share float, 53.52% or 106.07m shares are sold short. That seems a bit excessive.

3
2
6
$CGC touched the bottom trend on the large falling wedge today. It shouldn't be much longer.

5
0
6
With earnings in the after hours on Thursday, ticker symbol $FSR appears to be recovering from a liquidity grab much the same as $PLUG. On the daily we see the ticker is at the base of the descending support trend. I believe earnings will be bullish.


0
0
6
Add $ACHR to the list as it is in a similar situation. I expect the ticker to break from this by tomorrow 1400hrs CST.

2
1
6
Using a friend of mines script called "Algo Targets" it has the ability to read candle formations that point to certain price points yet to be achieved. It is not 100% guaranteed to meet the prices but it does have noticeable success. $AMC has one such target as shown below.

2
0
5