

CJARS
@UM_CJARS
Followers
883
Following
200
Statuses
210
Criminal Justice Administrative Records System
Joined July 2019
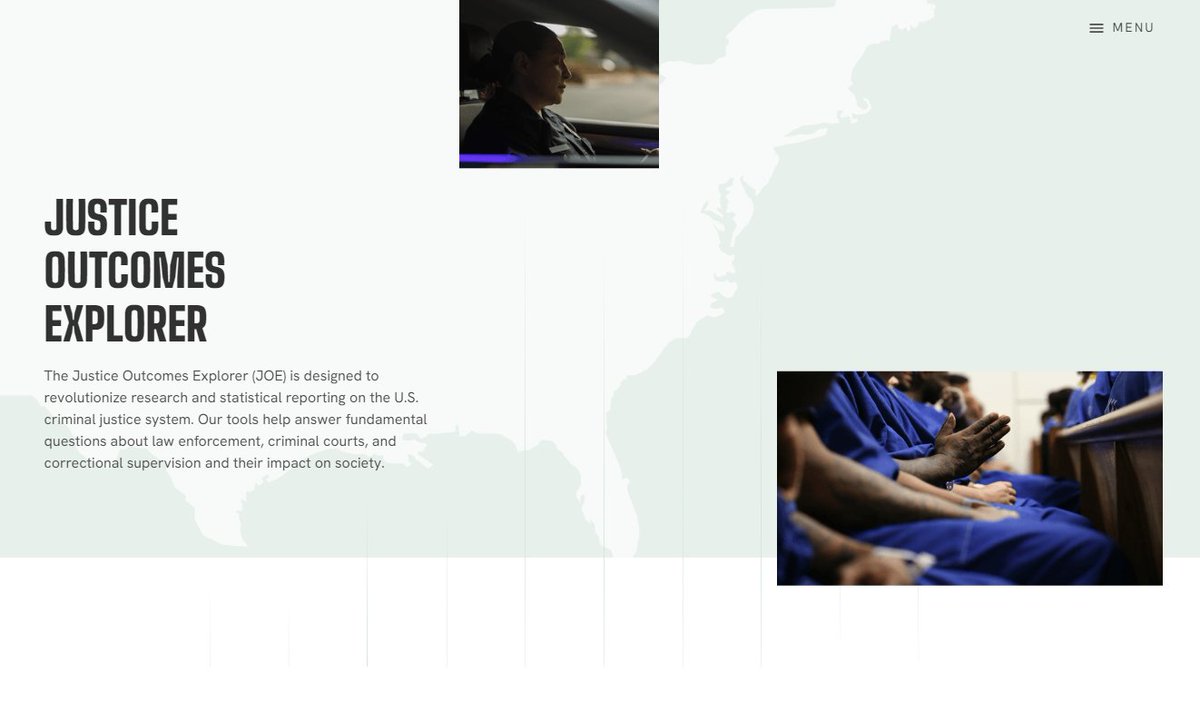
Today, we are proud to introduce the #JusticeOutcomesExplorer! JOE is a publicly available data dashboard that provides a fresh glimpse into how the criminal justice system touches the lives of millions of Americans every year: [1/10] 🧵
2
57
99
🚨🚨Only one week left to sign up for our JOE informational webinar! 🚨🚨 👉June 5th at 3 PM ET for a live demonstration of the site and Q&A moderated by @MarshallProj. Please sign up here if you are interested in attending:
0
2
2
RT @Econ_Mike: When I joined @umichECON and @UM_PSC years ago, I had no idea how much life would change. Since then, I’ve accomplished goal…
0
10
0
RT @Arnold_Ventures: The Criminal Justice Administrative Records System (@UM_CJARS) team will hold an informational webinar for the #Justic…
0
6
0
RT @MJGoellner: Playing with "JOE" - new data tool from @UM_CJARS, @UMich and @uscensusbureau designed to harmonize criminal justice data…
0
4
0
RT @JaneMWiseman: Exciting news for the justice data community. Thanks @Econ_Mike and @UM_CJARS team.
0
2
0
RT @basit_ak_zafar: Check out the really amazing granular data on justice outcomes, released by my @UM_CJARS today. This is a huge public…
0
5
0
That’s a wrap on our #JusticeOutcomesExplorer launch day tweets! Thanks for joining us!! Tune in for our JOE webinar with a Q&A moderated by @MarshallProj on June 5th at 3 PM ET. Registration can be found here:
0
1
5
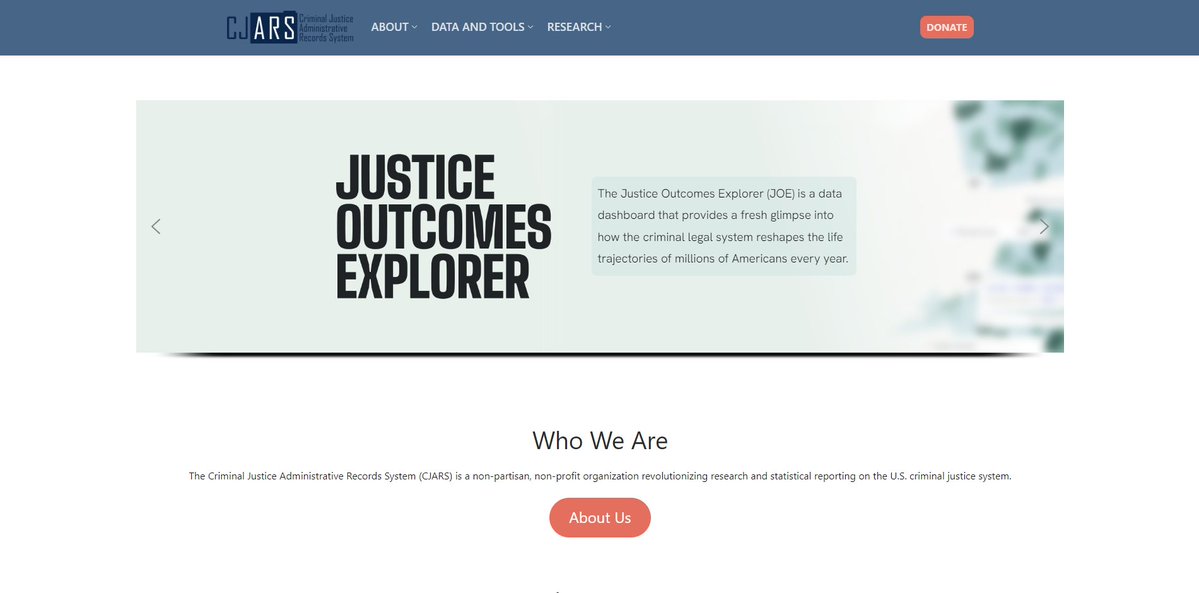
Wondering where all this amazing #JusticeOutcomesExplorer content came from!? Check out our project: the Criminal Justice Administrative Records System! Our website has info on how to partner & how to apply for secure access to underlying microdata.
0
2
4
You may notice that some counties in the #JusticeOutcomesExplorer share the exact same value on certain statistics. Learn about why that happens in our thorough Methodology write-up.
0
1
3
Be a responsible #JusticeOutcomesExplorer user and review our extensive data documentation if you plan to download the data and use it in a research project. Don’t forget to cite us please!
0
4
7
Ready to flex your analytic/creative muscles in ways that go beyond what the #JusticeOutcomesExplorer is designed to support? Diff-in-diff regressions? Custom visualizations? Download the full data with a simple registration process and have at it! Let us know what you find!!
0
2
7
Are you struggling with content overload in the #JusticeOutcomesExplorer? Too many different visualizations? Use the All Statistics tool to quickly summarize all outcomes together in a tabular view for your selected jurisdictions and cohorts.
0
1
2
The #JusticeOutcomesExplorer allows you to break out estimates by criminal history. We also produce a “reweighted” series that downweights repeat contact observations and upweights first contact observations to better reflect the average individual over a multi-year caseload.
0
2
2
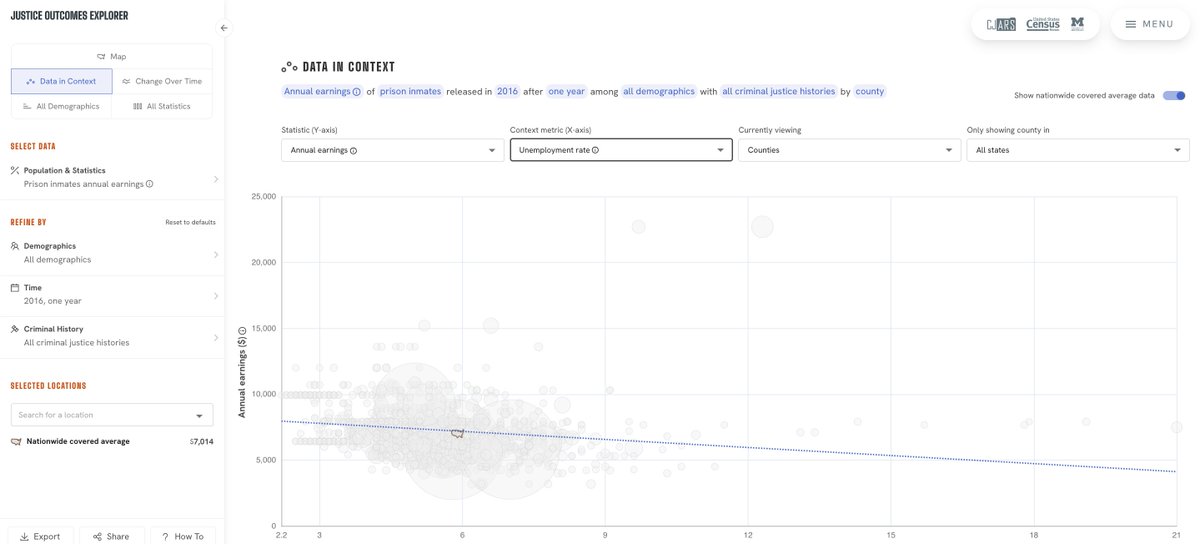
The Data in Context tool on the #JusticeOutcomesExplorer helps contextualize some patterns you might see on the map. For instance, prisoner post-release earnings are lower in areas with higher prevailing unemployment rates.
0
1
3
The #JusticeOutcomesExplorer Map tool allows you to view outcomes by state, commuting zone, and county geographies. Click to highlight a location or jurisdiction and it will carry over to the other tool visualizations.
0
2
3
Meet some of the team who made the #JusticeOutcomesExplorer possible with our informational video. We walk you through our goals for the site and how to get the most out of this novel resource!
0
2
2
RT @LaurawherryR: Congrats @UM_CJARS!!! I'm really in awe of this innovative and ambitious data effort - thank you for everything you do a…
0
6
0
The #JusticeOutcomesExplorer allows you to break out statistics by race/ethnicity, sex, age groups, and criminal history. Want to see the gaps across groups side-by-side? Use the All Demographics tool!!
0
1
4
Did you know that the #JusticeOutcomesExplore can help create tables and figures that you can embed reports? Use the “export” feature to either download a graphic or the subset of data currently in your frame!
0
2
3