

Kenya Data & Stats
@Stats_Kenya
Followers
10,485
Following
44
Media
776
Statuses
1,735
Kenya in Data. Learn important and interesting data and facts about Kenya. info @statskenya .co.ke
Kenya
Joined March 2023
Don't wanna be here?
Send us removal request.
Explore trending content on Musk Viewer
田中さん
• 458033 Tweets
田中敦子さん
• 433622 Tweets
声優さん
• 218890 Tweets
攻殻機動隊
• 146751 Tweets
Fate
• 141006 Tweets
LINGORM THE STYLER
• 139695 Tweets
ALRIGHT POSTER
• 129655 Tweets
ネルフェス
• 93056 Tweets
ショック
• 74237 Tweets
#西園寺さんは家事をしない
• 51692 Tweets
フランメ
• 47169 Tweets
#大神ミオ生誕ライブ2024
• 43865 Tweets
ラストマイル
• 42659 Tweets
#アイナナ9周年生放送
• 40136 Tweets
ドーピング
• 38966 Tweets
초코우유
• 32641 Tweets
メディアさん
• 26796 Tweets
キャスター
• 26670 Tweets
ベヨネッタ
• 25453 Tweets
女性の声
• 21695 Tweets
メアリー
• 17054 Tweets
カーミラさん
• 15216 Tweets
レインドット
• 13504 Tweets
岡田将生
• 13277 Tweets
リサリサ先生
• 12330 Tweets
スーパームーン
• 11656 Tweets
千速さん
• 10462 Tweets


Pinned Tweet

We Transform Your Data Collection: Unlocking the Power of Real-Time Survey Insights.
We understand that data collection can be time-consuming, prone to data entry errors, expensive, and hard to coordinate.
With us, surveys are made easy with three quick steps:
1. Our tools

2
6
8
Total number of Kenyans by tribe or ethnicity:
1. Kikuyu 8,148,668
2. Luhya 6,823,842
3. Kalenjin 6,358,113
4. Luo 5,066,966
5. Kamba 4,663,910
6. Somali 2,780,502
7. Kisii 2,703,325
8. Mijikenda 2,488,691
9. Meru 1,975,869
10. Maasai 1,189,522
11. Turkana 1,016,174
12. Teso

293
578
1K
Men in Kenya generally live shorter lives. The longest-living men can be found in:
1. Nyeri - 66.5
2. Mombasa - 65.7
3. Bungoma - 65.5
4. Baringo - 65.4
Life expectancy is lowest in:
1. Homa Bay - 50.5
2. Migori - 50.5
3. Siaya- 53.4
4. Kisumu - 54
5. Nyamira - 55.3

44
227
388
Total number of Luhyas by subtribe:
1. Luhya (So stated) 3,944,257
2. Bukusu 1,188,963
3. Maragoli 334,926
4. Banyala 227,165
5. Banyore 154,553
6. Kabras 136,962
7. Isukha 101,789
8. Wanga 94,190
9. Tiriki 93,393
10. Tachoni 85,597
11. Samia 84,828
12. Batsotso 72,687
13.

77
137
363
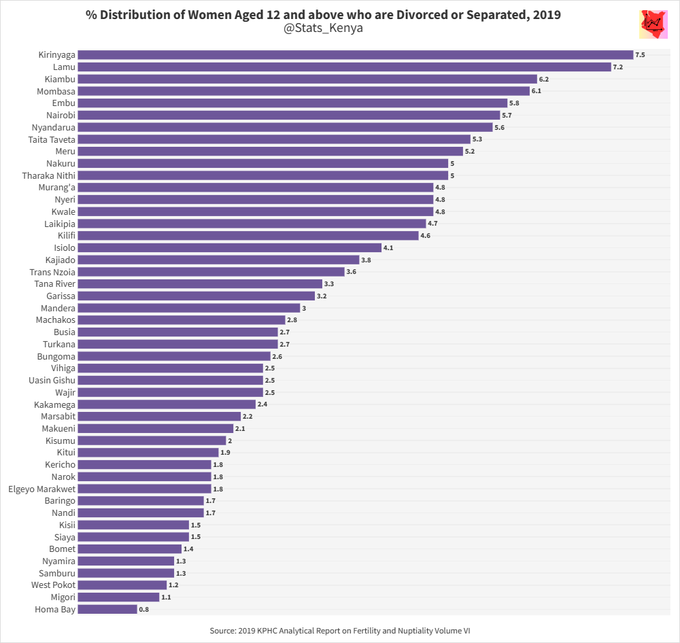
Which counties have the highest number of divorced or separated women?
1. Kirinyaga 7.5%
2. Lamu 7.2%
3. Kiambu 6.2%
4. Mombasa 6.1%
5. Embu 5.8%
6. Nairobi 5.7%
7. Nyandarua 5.6%
8. Taita Taveta 5.3%
9. Meru 5.2%
10. Nakuru 5%
106
168
297
Homicide versus Femicide!! How many men and women in Kenya are victims of murder annually?
From 2014 to 2021, three to five times more men than women have been victims of murders.
Year Male Female
2021 2,090 706
2020

104
216
277
How far is your county from Nairobi, and is there any relationship between a county's distance from Nairobi and its wealth?
Counties furthest from Nairobi are:
1. Mandera -964Km
2. Turkana -695Km
3. Lamu -694Km
4. Wajir -649Km
5. Marsabit -623Km
Counties nearest to Nairobi


34
129
277
Percentage of children who do not live with either parent even though both parents are alive:
1. Busia 22.1
2. Vihiga 21.1
3. Bungoma 19.6
4. Kakamega 19
5. Trans Nzoia 17
6. Nyamira 16.2
7. Kisii 14.4
8. Siaya 13.9
9. Turkana 13.8
10. Homa Bay 13.8
11. Samburu

97
113
234
How much each county spent on domestic travel in this financial year.
1. Turkana 1.14 Billion
2. Migori 894.3 m
3. Bungoma 696.2 m
4. Tana River 532.6 m
5. Nairobi 529 m
6. West Pokot 502.8 m
7. Kajiado 474.4 m
8. Machakos 464.4 m
9. Narok 431.4 m
10. Kwale 430.7 m

72
136
220
Poverty in Kenya and the counties. In 2021, Kenya had a headcount poverty rate of 38.6%.
Lowest poverty rate:
1. Nairobi 16.5%
2. Kirinyaga 19.3%
3. Kiambu 20.5%
4. Narok 21.9%
5. Meru 26.3%
6. Nyeri 26.4%
7. Homa Bay 26.6%
8. Murang'a 26.7%
9. Tharaka 28.1%
10. Embu 28.7%

59
123
215
As you prepare to pay your rent every month, always remember that 64% of Kenyan households own the house they live in and only 32% rent.
Highest renters are in:
1. Nairobi -88%
2. Mombasa -74%
3. Kajiado -56%
4. Kiambu -52%
5. Nakuru -45%
6. Uasin Gishu -42%
7. Kisumu -35%

19
96
212
Total number of beef cattle per county, 2020. Counties with the highest number of beef cattle were:
1. Turkana - 2,883,151
2. Narok - 1,402,306
3. Garissa - 1,337,617
4. Mandera - 1,156,432
5. Wajir - 893,032
6. Kajiado - 652,700
7. Marsabit - 508,112
8. Kitui - 506,733

21
100
203
Obesity in women aged 20-49 per county (BMI ≥ 30).
Highest:
1. Kirinyaga -29.3%
2. Nyeri -28.1%
3. Murang'a -26.9%
4. Lamu -26%
5. Kiambu -24.1%
Lowest:
1. Mandera -3.8%
2. Marsabit -3.9%
3. Turkana -3.9%
4. Samburu -5.3%
5. West Pokot -5.5%

53
130
200
The top five leading counties in agricultural production are:
1. Meru 7.6%
2. Nakuru 5.2%
3. Nyandarua 4.5%
4. Murang’a 4.1%
5. Kiambu 4%
These counties had diverse agricultural outputs, including tea, maize, coffee, vegetables, potatoes, and raw milk.

35
106
196
Comparison between Nyeri and Kisumu on various socioeconomic metrics. Out of 23 variables included in this list, Nyeri scores better than Kisumu on 16 of them.
Overall, Nyeri outranks Kisumu in poverty rates, GDP per capita, average county contribution to agriculture, access to

Can Nyeri be compared to Kisumu? What are the relevant metrics? Suggest in the comments, and we will make the comparison.
24
12
38
42
103
194
Do A students work for C students? In 2016, results from a survey of Micro, Small, and Medium Enterprises (MSMEs) were published, highlighting the characteristics of Kenyan businesses and their owners.
A result that stood out was the educational attainment of business owners.


24
135
193
How many years were countries colonized?
Kenya -69 years
Uganda -69 years
Tanzania -73 years
Somalia -73 years
India -91 years
Angola -400 years
South Africa -262 years
Ghana -426 years
Canada -312 years
USA -177 years
Brazil -290 years
Indonesia -340 years
Philippines -334yrs

25
87
181
Do A students work for C students? In 2016, results from a survey of Micro, Small, and Medium Enterprises (MSMEs) were published, highlighting the characteristics of Kenyan businesses and their owners.
A result that stood out was the educational attainment of business owners.


12
121
185
Kenya is projected to have 70,180,000 people in 2045, with Nairobi 6,180,000, Kiambu 3,717,000, and Nakuru 3,372 being the most populous.
Regionally, the Mt Kenya region will have 15,233,000 people, Rift Valley 9,489,000, Nyanza 9,053,000, Western 6,967,000, Coast 6,932,000.

46
71
181
Men in Kenya generally live shorter lives.
The longest-living men can be found in:
1. Nyeri - 66.5
2. Mombasa - 65.7
3. Bungoma - 65.5
4. Baringo - 65.4
Life expectancy is lowest in:
1. Homa Bay - 50.5
2. Migori - 50.5
3. Siaya- 53.4
4. Kisumu - 54
5. Nyamira - 55.3

41
101
177
Average monthly sitting allowance for every MCA in each county.
1. Busia 101,533/=
2. Mombasa 100,651/=
3. Migori 97,222/=
4. Homa Bay 93,923/=
5. Nyeri 79,453/=

55
130
172
Milk produced per county in 2020.
The top 5 counties with the highest milk production were Nakuru, Kiambu, Nyandarua, Meru, and Uasin Gishu

26
101
170
Total number of the Kalenjin by subtribe:
1. Kipsigis 1,905,983
2. Kalenjin (So Stated) 1,553,057
3. Nandi 937,884
4. Pokot 778,408
5. Sabaot/Kony/Bong'omek 296,374
6. Keiyo 251,441
7. Tugen 197,566
8. Marakwet 119,969
9. Arror 92,470
10. Lembus 71,600
11. Ogiek 52,596
12.

39
72
156
Many people are curious about cancer in Kenya. The Kalenjin are especially concerned.
Get me to 5000 followers, and I'll post some interesting cancer statistics drawn from Kenyatta and Moi Referral Hospitals. Data exists for Kalenjin, Luo, Luhya, Kikuyu, Somali, Kisii, Kamba.
6
48
156
County GDP per Capita (Ksh). Counties with the highest GCP per capita are Nairobi, Mombasa and Nyeri.
1. Nairobi 723,335
2. Mombasa 439,390
3. Nyeri 293,944
4. Embu 292,827
5. Nyandarua 290,577
6. Kiambu 277,147
7. Nakuru 261,188
8. Machakos 257,025
9. Kisumu

28
96
150
Percentage of territory effectively controlled by the government.
Kenya - 90.8%
Tanzania - 77.6%
Uganda - 96%
Ethiopia - 60%
Somalia - 69.8%
South Sudan - 40%
USA - 97%
China - 96.8%
South Africa - 99.3%

16
59
149
Prevalence of FGM among Kenyan tribes.
1. Somali 93.6%
2. Samburu 86%
3. Kisii 84.4%
4. Maasai 77.9%
5. Meru 30.7%
6. Embu 30.7%
7. Kalenjin 27.9%
8. Taita/Taveta 22.3%
9. Kikuyu 14.6%
10. Kamba 10.7%
11. Mijikenda/Swahili 2.4%
12. Turkana 1.7%
13. Luhya 0.4%
14. Luo 0.2%

112
78
151
African countries by total population:
1 Nigeria 216,783,400
2 Ethiopia 107,334,000
3 Egypt 102,060,688
4 DR Congo 95,370,000
5 Tanzania 61,741,120
6 South Africa 59,604,992
7 Kenya 51,526,000
10 Algeria 44,700,000
9 Sudan 41,984,500
8 Uganda 41,583,600
11 Morocco 35,372,615
12

16
62
148
Percentage of men who agree it is justified to beat their wives for any reason:
1. Isiolo 79.6
2. West Pokot 71.2
3. Mandera 70.4
4. Marsabit 69.2
5. Samburu 68.8
6. Narok 67.9
7. Migori 64.2
8. Bomet 63.4
9. Murang'a 56.9
10. Elgeyo Marakwet 55
11. Turkana 53.6
12.

69
87
150
Counties with the highest number of divorced or separated women.
1. Kirinyaga 7.5
2. Lamu 7.2
3. Kiambu 6.2
4. Mombasa 6.1
5. Embu 5.8
6. Nairobi 5.7
7. Nyandarua 5.6
8. Taita Taveta 5.3
9. Meru 5.2
10. Tharaka Nithi 5
11. Nakuru 5
12. Kwale 4.8
13.

56
91
152
Which counties do women live the longest? Life expectancy was highest in Nyeri County, where an average woman lives for 75.8 years.
1. Nyeri - 75.8
2. Kiambu - 72.8
3. Laikipia - 71.9
4. Uasin Gishu - 71.7
5. Mombasa - 71.1
6. Kirinyaga - 71.1
7. Tharaka - 70.3
8. Embu - 70.1

6
80
144
Which cancers are common in your region or tribe? Recently, there have been concerns about cancer in Kenya. More important has been the concern that some cancers are common in some tribes.
For example, cancer of the oesophagus is said to be more common among the Kalenjin. 🧵
A


19
99
142
Due to Public Demand: What is Kenya's average IQ, and how was it measured? Kenya has an average IQ of 75.2.
1. EMBU 79.62
2. EMBU 77.96
3. NAIROBI 75.08
4. NAKURU 72.47
5. KILIFI 70.05
6. BONDO, Ugingo Village 65.62
For more details, this post summarizes

64
64
139
Total number of branches for leading local and international retail supermarket chains in Kenya.
1. Naivas -97 branches
2. Quick Mart -59 branches
3. Chandarana -26 branches
4. Carrefour -20 branches
6. Tuskys -5 branches
7. Uchumi -2 branches
8. Nakumatt -0 branches

29
54
138
How much poultry meat is produced by the counties? The top 5 highest producers of poultry meat in the country were:
1. Kitui - 6,693,855kg
2. Nandi - 6,368,155kg
3. Migori - 5,841,568kg
4. Homa Bay - 5,540,546kg
5. Kisumu - 4,440,754kg

22
64
132
Food poverty rate (%) in Kenya by County
1. Mandera 65.5
2. Turkana 63.4
3. Samburu 60.2
4. Marsabit 55.6
5. Tana River 49.5
6. Busia 49
7. Garissa 47.2
8. West Pokot 46.8
9. Vihiga 42.6
10. Kilifi 41.4
11. Wajir 40.1
12. Taita Taveta 37.2
13. Kisii 36.3
14. Kwale

38
82
131
How much money has your county generated from its own sources since the start of devolution?
1. Nairobi 83.2B
2. Mombasa 23.8B
3. Kiambu 17.2B
4. Nakuru 17.1B
5. Narok 14.7B
6. Machakos 10.2B
7. Kisumu 6.9B
8. Uasin Gishu 6.4B
9. Kajiado 5.7B
10. Nyeri 5.6B

28
90
130
Crime rates in Kenya per county. Different counties have different levels of crime relative to their populations.
Highest crime rate:
1. Meru 326
2. Lamu 281
3. Kirinyaga 277
4. Murang'a 255
6. Embu 252
7. Laikipia 247
8. Nyandarua 244
9. Isiolo 240
10. Kiambu 236
Lowest

49
66
129
Murder perpetrators by sex: This is a follow-up post that aims to provide more context on the nature of male and female homicides in the country.
First, worth noting is that both men and women can be perpetrators of violence and murder, with the difference being


17
85
128
Average mathematics scores in Eastern and Southern Africa. How do class 6 pupils across the region perform?
1. Mauritius 644.1
2. Kenya 608.1
3. Seychelles 599.1
4. Swaziland 577.6
5. Botswana 562.9
6. South Africa 551.5
7. Zimbabwe 524.1
8. Uganda 523.5
9. Namibia 522.4

20
61
127
County
#22
: Kiambu
Kiambu generally has low levels of poverty with the lowest levels in:
1. Thika Town
2. Gatundu North
3. Lari
4. Gatundu South
5. Githunguri
Highest poverty:
1. Ruiru
2. Kabete
3. Kiambaa
4. Limuru
The 2021 overall headcount poverty rate was 20.5%

11
49
120
Homicide rate per 100,000 population in each county:
1. Nyamira 21.96
2. Nyeri 15.81
3. Embu 15.12
4. Murang'a 13.44
5. Marsabit 12.83
6. Makueni 12.15
7. Kirinyaga 9.99
8. Meru 9.83
9. Kisii 9.71
10. Tharaka Nithi 9.16
11. Siaya 9.06
12. Laikipia 8.49
13. Nyandarua 8.46
14.

33
69
123
Corruption in Africa. Below is a list of African countries ranked based on their Corruption Perception Index (CPI) score that runs from 0 (most corrupt) to 100 (very clean).
1. Seychelles🇸🇨 70
2. Botswana🇧🇼 60
3. Cabo Verde🇨🇻 60
4. Rwanda🇷🇼 51
5. Mauritius🇲🇺 50
6. Namibia🇳🇦 49

40
70
121
Women who had intercourse in the last 12 months with someone who was neither their husband nor lived with them:
1. Kericho 27.9%
2. Muranga 27.7%
3. Nandi 25%
4. Uasin Gishu 24.5%
5. Bungoma 23.6%
6. Kiambu 22.8%
7. Nairobi 22.7%
8. Elgeyo Marakwet 22.1%
9. Homa Bay 21.2%

63
87
116
KCSE Results, 2023
Female Male
A 391 ...... 825
A- 2,782...... 4,472
B+ 7,708...... 10,370
B 16,906...... 19,822
B- 28,993...... 30,521
C+ 39,455...... 38,888
C 48,411...... 44,201
C- 56,855...... 50,616
D+

20
55
114
Total number of Kenyan Somalis by subtribe:
1. Ogaden 697,566
2. Gurreh 602,174
3. Kenyan Somali (So Stated) 579,701
4. Degodia 515,583
5. Ajuran 182,276
6. Murule 139,097
7. Corner Tribes 40,640
8. Leysan 11,636
9. Isaak 7,417
10. Hawiyah 4,412
Note: The Somali (So stated)

24
33
113
Until today, Kenya had both a ruling party and a dominant opposition party. However, that may no longer be the case.
The maps below show the results of the treachery witnessed today.
Gen Zs have to reclaim what has been lost. Shame the traitor.


5
80
116
The Rural Access Index measures the share of the population living within two kilometers of an all-season road. It was highest in Kirinyaga at 98% and lowest in Wajir at 2%.
1. Kirinyaga 98
2. Murang'a 97
3. Mombasa 95
4. Bomet 95
5. Nairobi 95
6. Nyeri 94
7.

15
62
116
Distribution of the Islamic population in Kenya by county:
1. Mandera 856,450
2. Garissa 815,755
3. Wajir 767,312
4. Kwale 520,160
5. Mombasa 450,740
6. Nairobi 326,809
7. Tana River 256,422
8. Kilifi 253,966
9. Marsabit 217,079
10. Isiolo 193,775
11. Kakamega 88,412
12. Lamu

31
38
112
Total number of the Mijikenda by subtribe:
1. Giriama 1,007,653
2. Duruma 555,135
3. Digo/Wafundi/Wasakwa 409,595
4. Chonyi 198,653
5. Rabai 125,707
6. Kauma 71,061
7. Mijikenda (So Stated) 40,724
8. Jibana 38,466
9. Kambe 31,007
10. Ribe 10,690
Note: The Mijikenda (So stated)

18
30
106
County Expenditures on Foreign Travel. We have mapped out all the destinations where county executives and MCAs traveled to in 2022 and 2023.
Highest spending counties:
1. Kiambu 85,059,837
2. Murang'a 78,618,503
3. Meru 72,130,748
4. Kitui 68,669,725
5. Bomet 53,743,377
6.

15
80
103
Does Kenya have minerals? Which ones and where are they found? Find them here:

8
79
108
Percent population in each county that has completed university.
1. Nairobi 8.83
2. Kiambu 6.55
3. Kajiado 6.0
4. Uasin Gishu 4.97
5. Mombasa 4.03
6. Machakos 3.86
7. Kisumu 3.71
8. Nyeri 3.34
9. Nakuru 3.18
10. Kericho 2.90
11. Tharaka Nithi 2.89
12. Kisii 2.82
13. Baringo

26
58
105
Which counties do Kenya's domestic migrants come from, and where do they go to? The chart below shows the top 13 in-migration and out-migration counties.
In-migration counties per 1000 population:
1. Kajiado 90
2. Kiambu 72
3. Mombasa 61
4. Nairobi 52
5. Lamu 49
6. Uasin

19
67
104
Do you have roads in your county? The Rural Access Index is the proportion of the rural population who live within 2km of an all-season road - W.B
It was highest in:
1. Kirinyaga - 98%
2. Murang'a - 97%
3. Nairobi -95%
Lowest:
1. Wajir - 2%
2. Mandera - 4%
3.

25
52
102
Satellites can tell us how rich and urbanized a region is based on the sum of lights seen from space at night. These were the wealthiest counties based on nightlight data from a 2013 World Bank study:
1. Nairobi
2. Kiambu
3. Nakuru
4. Kajiado
5. Nyeri
6. Mombasa
7. Machakos

10
45
102
Percent population in each county that has completed university.
1. Nairobi 8.83
2. Kiambu 6.55
3. Kajiado 6.0
4. Uasin Gishu 4.97
5. Mombasa 4.03
6. Machakos 3.86
7. Kisumu 3.71
8. Nyeri 3.34
9. Nakuru 3.18
10. Kericho 2.90
11. Tharaka Nithi 2.89
12. Kisii 2.82
13. Baringo

36
65
99
How many males and females aged 12-15 are married? Yesterday, I posted a chart showing "women aged 12 and above" who are divorced, and there was contention as to whether 12-year-olds can be married.
To provide more context and to further enrich the discussion, the chart below

40
53
102
Percent distribution of married men with 2+ wives in each county:
1. Kwale 31.6
2. Mandera 19.7
3. Turkana 17.9
4. Wajir 16.5
5. Migori 15.1
6. West Pokot 15
7. Samburu 14.7
8. Homa Bay 14.3
9. Busia 10.7
10. Siaya 9.8
11. Narok 8.5
12. Garissa 8.1
13. Tana River 6.8
14. Isiolo

65
43
100
The size of Kenya's lakes. Lake Turkana is the largest lake at 6,405 km² followed by L. Victoria at 3,855 km²

2
39
97
Total number of the Swahili population by subtribe:
1. Swahili (So Stated) 17,232
2. Munyonya/Muyeya 15,024
3. Amu 5,143
4. Jomvu 4,728
5. Barawa 4,633
6. Vumba 1,449
7. Wachangamwe 1,344
8. Pate 1,120
9. Ngare 1,057
10. Siu 1,016
11. Wakilifi 685
12. Wakilindini 642
13.

27
28
92
How many health facilities does your county have? Below are all public and private health facilities from Level 2 to Level 5&6. The highest number of facilities were in:
1. Nairobi
2. Kiambu
3. Nakuru
4. Meru
5. Machakos
Lowest:
1. Lamu
2. Isiolo
3. Tana River
4. Samburu

9
72
93
Which counties produce the highest number of eggs? Most eggs in Kenya predominantly come from:
1. Uasin Gishu
2. Nairobi
3. Kakamega
4. Kwale
5. Tharaka Nithi
6. Nyamira
7. Kiambu
8. Elgeyo Marakwet
9. Kisii
10. Nyandarua

19
41
92
Percentage of female-headed households in each county:
1. Samburu 60.9
2. Mandera 54.7
3. Turkana 53.3
4. Siaya 47.7
5. Garissa 46.8
6. Homa Bay 46.7
7. Wajir 46.1
8. Marsabit 45.9
9. Kitui 45.1
10. Narok 43
11. Migori 42.4
12. Busia 41.7
13. West Pokot

38
45
89
There should never be any doubt about where the sovereignty belongs. We condemn the killing of innocent protestors.

4
81
91
Polygamy by county and the percentage of women with one or more co-wives. 9.2% of married women aged 15-49 have one or more co-wives.
1. Turkana 47.6
2. Wajir 37.5
3. West Pokot 30.7
4. Samburu 30.7
5. Mandera 26.2
6. Homa Bay 24.9
7. Baringo 23.1
8. Garissa 22.3
9.

34
38
87
Who is Kenya's main employer? In 2019, Kenya had 17,041,747 employed people. A majority (23%) were self-employed informally, 21.9% were self-employed in small scale agriculture, 14.9% employed in the private sector, and 13% employed in small-scale agriculture.
1. Self Employed

8
41
90
Time to check grass-thatched houses in each county. The results will shock you. 😀

If someone has a grass thatched house in Nyeri, give them Ksh50,000 to build one with iron sheets - Senator Eddy Oketch

41
90
1K
15
38
88
A survey of Kenyans in the diaspora in 2021 by the CBK found that a majority came from Nairobi (26%), Kiambu 10%, and Nyeri 6%.
1. Nairobi 26%
2. Kiambu 10%
3. Nyeri 6%
4. Nakuru 4%
5. Mombasa 4%
6. Kisumu 3%
7. Kakamega 3%
8. Kisii 3%
9. Murang'a 3%
10. Bungoma 2%
11. Machakos

22
29
88
Marsabit is the largest county in Kenya, with a total land area of 71,905 sq. Km. The second largest is Turkana at 68,307, then Wajir at 56,649 sq. Km.
1. Marsabit 71,905
2. Turkana 68,307
3. Wajir 56,649
4. Garissa 43,591
5. Tana River 39,153
6. Kitui

11
55
89
Kenya's major export destinations in millions, 2023.
1. Uganda 113,789.52
2. Pakistan 78,624.40
3. Netherlands 65,065.60
4. USA 59,410.90
5. Tanzania 55,959.11
6. UK 53,827.39
7. UAE 44,228.35
8. Rwanda 37,770.62
9. Egypt 30,967.33
10. Germany 15,743.57
11. France

13
23
86
Distribution of the Catholic population in Kenya:
1. Nairobi 1,041,619
2. Kiambu 588,975
3. Machakos 500,155
4. Kisii 429,285
5. Turkana 406,439
5. Nakuru 349,527
7. Meru 313,277
8. Kakamega 306,477
9. Makueni 292,056
10. Bungoma 291,998
11. Busia 266,299
12. Murang'a

13
30
86
Which drug or substance is common in your region?
1. Tobacco use is more common in Central and Eastern.
2. Khat is mostly consumed in Eastern and N. Eastern.
3. Cannabis is mostly smoked in Nairobi.
4. Alcohol is mostly consumed in Western.

10
43
84
Military Aircraft Crashes and Fatalities, 1992 - 2024
1. "Kenya Airforce"18 April 2024 8 fatalities
2. Harbin Yunsunji Y-12 (2021) 4 fatalities
3. Harbin Yunsunji Y-12(2020) 0
4. Harbin Yunsunji Y-12(2014) 1 fatality
6. Harbin Yunsunji Y-12(2006) 14 fatalities
7. De

9
46
82
We've updated our chart on average class 6 mathematics performance across regions to include 14 more French-speaking countries.
1. Mauritius🇲🇺 644.1
2. Kenya🇰🇪 608.1
3. Seychelles🇸🇨 599.1
4. Swaziland🇸🇿 577.6
5. Botswana🇧🇼 562.9
6. Senegal🇸🇳 557.6
7. Gabon🇬🇦 554.6
8.

7
37
82
Percent distribution of men without schooling who cannot read at all:
1. Turkana 43.6
2. Mandera 37.4
3. Tana River 32.6
4. Marsabit 29.6
5. Samburu 26.9
6. Wajir 21.6
7. Narok 21
8. Garissa 20.7
9. West Pokot 17
10. Busia 15.8
11. Kwale 15.1
12. Meru 13.6
13. Bungoma 11.9
14.

21
37
79
Number of bank deposits with more than Ksh 500,000.
NCBA bank had 416,481 bank accounts with more than half a million, followed by Equity Bank with 124,098 accounts.

12
34
83
The use of contraception in Kenya is highest in the Mt. Kenya region. Modern use of contraception among married women was highest in Embu 75.2%, Kirinyaga 70.8%, and Nyeri 70.5%.
1. Embu 75.2
2. Kirinyaga 70.8
3. Nyeri 70.5
4. Meru 69.7
5. Kiambu 68.2
6. Tharaka Nithi

22
42
79
Which counties have the highest number of people living with HIV?
1. Nairobi
2. Homabay
3. Kisumu
4. Siaya
5. Migori
Check the next post for prevalence rates.
#WorldAIDSDay2023
#aidsday2023

5
54
76
How much money has your county received from the equitable share allocation since the start of devolution?
Highest:
1. Nairobi -131B
2. Turkana -94B
3. Kakamega -87B
4. Mandera -85 B
5. Nakuru -83B
6. Kilifi -81B
7. Kiambu -77B
8. Bungoma -75B
9. Kitui -73B
10. Wajir -70B

12
52
78
Visitors to Kenya stay, on average, 13 nights. This is an interesting indicator, considering that more attention is paid to the annual number of visitors.
Kenya 13 nights
Egypt 10.5
Uganda 8.3
Nigeria 7
Italy 3.7
Finland 1.8
Japan 1.3

12
41
79
Employment to Population Ratio: Proportion of the working-age population that is employed.
1. Kirinyaga 76.7
2. Nyandarua 75.3
3. Murang'a 74.4
4. Nyeri 73.9
5. Embu 73.6
6. Taita Taveta 70.8
7. Tharaka Nithi 69.9
8. Narok 69.9
9. Kericho 69.9
10. Laikipia 69.6
11.

15
36
76
As we end the year, tell us what kind of data you want to see in 2024.
In the coming year, we plan to provide as much data as possible, ensuring all Kenyans are statistically informed of their country, county, and surroundings. Happy New Year!
37
16
77
Many business models in Kenya are wrapped around selling goods and services online. Yet very few people in Kenya have ever bought a good or service online, despite higher internet, mobile, and smartphone penetration.
What could be the problem?

37
31
76
The number of people in each generation in Kenya.


What generation are you? 🤔
Lost Generation – 1883-1900
Greatest Generation – 1901-1927
Silent Generation – 1928-1945
Baby Boomer – 1946-1964
Generation X – 1965 - 1980
Millennial – 1981-1996
Generation Z – 1997-2012
Generation Alpha – 2013 - present
1K
2K
10K
5
47
77
Average class 6 mathematics performance for countries that participate in SACMEQ and PASEC.
1. Mauritius🇲🇺 644.1
2. Kenya🇰🇪 608.1
3. Seychelles🇸🇨 599.1
4. Swaziland🇸🇿 577.6
5. Botswana🇧🇼 562.9
6. Senegal🇸🇳 557.6
7. Gabon🇬🇦 554.6
8. Tanzania🇹🇿 553
9. South Africa🇿🇦 551.5
10.

5
42
75
"25 years ago, according to data published by the World Bank, only 5% of people in Kenya had access to basic electricity and its benefits.
Since then, the country has made substantial progress. By 2020, 71% of Kenyans had access to a basic electricity supply."

Today's Data Insight by
@maxcroser
:
From 5% to 71% in 25 years: Kenya has made substantial progress in providing access to electricity
🔗

15
114
381
5
51
76
In most counties, private health facilities outnumber public facilities. Highest number of public health facilities are in:
1. Kitui - 296
2. Makueni - 238
3. Baringo - 224
4. Nakuru - 203
5. Homa Bay -198

6
63
75
Poverty in Kenya is more common among widows 48.3%, those married polygamously 46.9%, and widowers 42.3%.
The never-married (22.1%) and those married monogamously (33.1%) had the lowest levels of poverty.

10
38
75
Percent distribution of population that is financially healthy:
1. Trans Nzoia 37
2. Nairobi 35.3
3. Kiambu 29.9
4. Kirinyaga 29.5
5. Kajiado 27.7
6. Murang'a 27.6
7. Nyeri 26.8
8. Siaya 26.7
9. Laikipia 26.3
10. Nyandarua 21
11. Taita Taveta 20.8
12. Isiolo

19
47
70
Gen Zs are indeed a force to reckon with. In 2019, Gen Zs (those between age 7 and 22 in 2019) were 18 million, followed by millennials (age 23 -38) at 11.3 million.
In 2027, Gen Zs, who were 10 in 2019, will be 18 and capable of voting. GoK needs to take Gen Zs seriously.

4
46
74
Average county contribution to agriculture, forestry, and fishing activities 2018-2022.
1. Meru 7.6%
2. Nakuru 5.2%
3. Nyandarua 4.5%
4. Murang'a 4.1%
5. Kiambu 4.0%
6. Bungoma 3.7%
7. Kisii 3.7%
8. Nandi 3.7%
9. Kakamega 3.7%
10. Bomet 3.6%

7
41
72
Household access to electricity in Kiambu county: 91.9%.


Can we get some county-by-county stats on this?
I was with
@JohnmarkNjihia
on the Thika-Gatura road the other day and we talked about how rural Kiambu is well-connected.
3
2
9
17
28
69
Percentage of women aged 15-49 who have experienced physical violence by an intimate partner or husband in the past 12 months:
1. Embu 31.7%
2. Migori 28.9
3. Kisumu 28.7
4. Samburu 28.2
5. Isiolo 27.4
6. Homa Bay 24.5
7. Bungoma 24.1
8. Tana River 22.3
9. Busia

30
51
71
How many secondary schools does your county have? The highest number of high schools are in Nakuru, Kitui, Kakamega, and Machakos.
Highest Public Schools;
1. Kitui
2. Kakamega
3. Makueni
4. Meru
Highest Private Schools
1. Nairobi
2. Nakuru
3. Kiambu
4. Machakos

6
32
68
Faith Kipyegon is Kenya's most GOATED Olympic athlete, with four medals.
3 gold
1 silver
- Kipchoge Keino has 2 gold and 2 silver
- Eliud Kipchoge has 2 gold, a silver, and a bronze
- Beatrice Chebet ties with Rudisha and Kemboi with 2 gold medals each.

3
44
70
91% of Kenyan one-year-olds are vaccinated against polio compared to 86% in South Africa, 80% in the world, 70% in Africa, and 53% in Nigeria.

1
41
68
HIV prevalence among some key populations in Kenya:
Female sex workers - 29.3%
People who inject drugs - 18.7%
Homosexuals - 18.2%
General population - 4%

7
46
63