Observable
@observablehq
Followers
26K
Following
5K
Media
672
Statuses
4K
The end-to-end solution for developers who want to build and host dashboards that don’t suck.
San Francisco, CA
Joined September 2017
Writing data wrangling code can be challenging, so we built the Data Wrangler to help compose and preview transformations using the amazing Arquero package (by @uwdata // @jeffrey_heer). Check it out!
4
43
240
🗳 Nobody knows what the outcome of the presidential election will be — but with a radial dendrogram you can try to visualize all the possibilities at once: .👀 #dataviz #Election2020 #DataVisualization
2
42
216
🤔 Are you comfortable doing data science in #Python, but want to leverage the interactive nature of #JavaScript? . 👉 Check out our newest tutorial on learning JavaScript for python users and learn JavaScript basics in no time here:
3
40
169
In a new Observable Framework dashboard, @smplrspace CTO @tibotiber combines a 3D indoor CO2 heatmap with interactive charts made with Observable Plot. See it live: and start building with Observable today:
1
32
181
🎉 We're excited to launch real-time collaboration on Observable! . Invite up to 4 other people to co-edit 🎮 real-time with you! 🤜 🤛 . Learn more about Collaborating in Observable - 💞. Looking forward to working with you! 💃 .#dataviz.
4
40
178
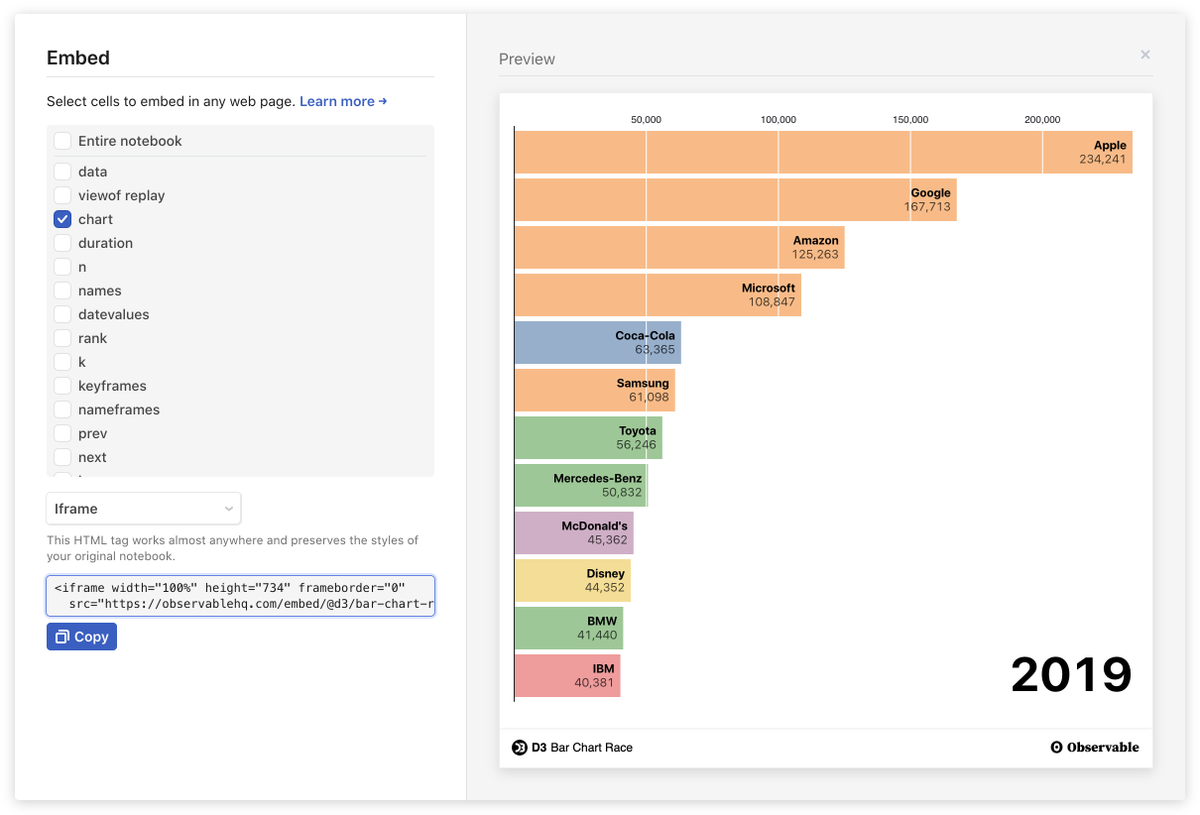
📣Today we are launching an easier way to embed your fully interactive #dataviz from Observable to other platforms where you want to share your work! . Check out our announcement for more information ➡️
4
38
159
Election maps can mislead when colored regions are sized to the land area instead of the number of votes. @karim_douieb shows how in his notebook: #dataviz #Election2020.
Challenge accepted! Here is a transition between surface area of US counties and their associated population. This arguably provides a much more accurate reading of the situation. @observablehq notebook: #HowChartsLie #DataViz #d3js
1
34
136
If you want to quickly code an interactive report or analysis and email it to colleagues or host it on an intranet, integrating @rstudio or @ThePSF and Observable @JavaScript in @quarto_pub could be a great choice. Learn more:
0
21
119
In this well-explained notebook, @BrianHulette shows how you can use Apache Arrow to load and analyze over 1.5 million Scrabble games.
1
32
109
🎨📊 Ever wondered how top-notch web visualizations are made? Discover @d3js_org with us, from web essentials to dynamic interactions. Whether you're a seasoned pro or just starting out, there's something for everyone. 👉
0
21
113
Developers in the real estate industry can quickly combine digital 3D floor plans w/ data layers for fast interactive dashboards using @smplrspace + Observable. Learn how Smplrspace CTO @tibotiber uses Observable for user-facing analytics & internal BI:.
0
12
106
Arquero is a new JavaScript library for query processing and data transformation. Check out this illustrated guide to Arquero Verbs.by @jeffrey_heer
0
25
94
Something's new at Observable! We've upgraded our design & made it easier to find & explore notebooks. The details from designer @mayaqgao:
0
21
92
💫 Introducing Observable Ambassadors: folks who are passionate about visualizing data & supporting the community. "Observable matters because of the creative & inspiring members of the community." ❤️️ @Cass_Ferrara . Learn More 👉
1
17
91
A Voronoi Cloth built on Observable!.Developed for the LIRIS M2i project by Sylvain Lesage. A mashup of Voronoi Particules and Cloth Simulation using relaxed constraints solver from Three.js examples. 👀 #dataviz
2
6
79
Observable Plot is a free, open-source JavaScript library to help you quickly visualize tabular data. It has a concise and (hopefully) memorable API to foster fluency — and plenty of examples to learn from and copy-paste. #observableplot #dataviz
0
15
79
In 2020, @observablehq team grew from 6 to 19! Empathy is on our minds more than ever, and remembering to focus on human needs first. 💕. We put ourselves in your shoes by using Observable, we share in your joys & frustrations as users. ❓Is there anything you need from us?
7
2
79
We created the free #dataviz tool below to illustrate how data visualization can help better inform users before they delete their Twitter accounts and abandon years of valuable data. Save & analyze your trove of data before it is gone forever. 👉
0
40
71
CONGRATS to the winners of our #WomensHistoryMonth #DataViz Contest!. In no order: @nicolaraluk @inari_ta @carmen_TM_ @karim_douieb @OliviaFVane 🏆 👏. Read all about the contest & the winning entries here: Huge thanks to everyone who participated! 🙌.
0
24
72
Observable is committed to equality for all of our community, its creators, and our employees. We are committed to prioritizing marginalized people’s safety over privileged people’s comfort and to support the efforts to end racism. #BlackLivesMatter.
0
5
67
💅 @prettiercode in Observable is now a click away: formats your code automatically to keep your notebooks clean and tidy!
2
6
70
🗓️ SAVE THE DATE! . Beginning on March 7th, Data Visualization Developer Robert Kosara @eagereyes will lead Observable's course on Data Visualization Fundamentals and Best Practices. 👀 Be on the lookout next week when we share the sign-up link!
0
8
63
EXCITING NEWS: today Observable secured Series B funding in partnership with @MenloVentures, @sequoia & @AcrewCapital! 🎉.
6
7
63
Data Journalists @xavigimenez & @MarieSegger at @TheEconomist outline how Observable notebooks, data visualization libraries, and other data-related tools free up time to explore, ideate, experiment and ultimately craft the best data-driven stories. 👉
0
12
61
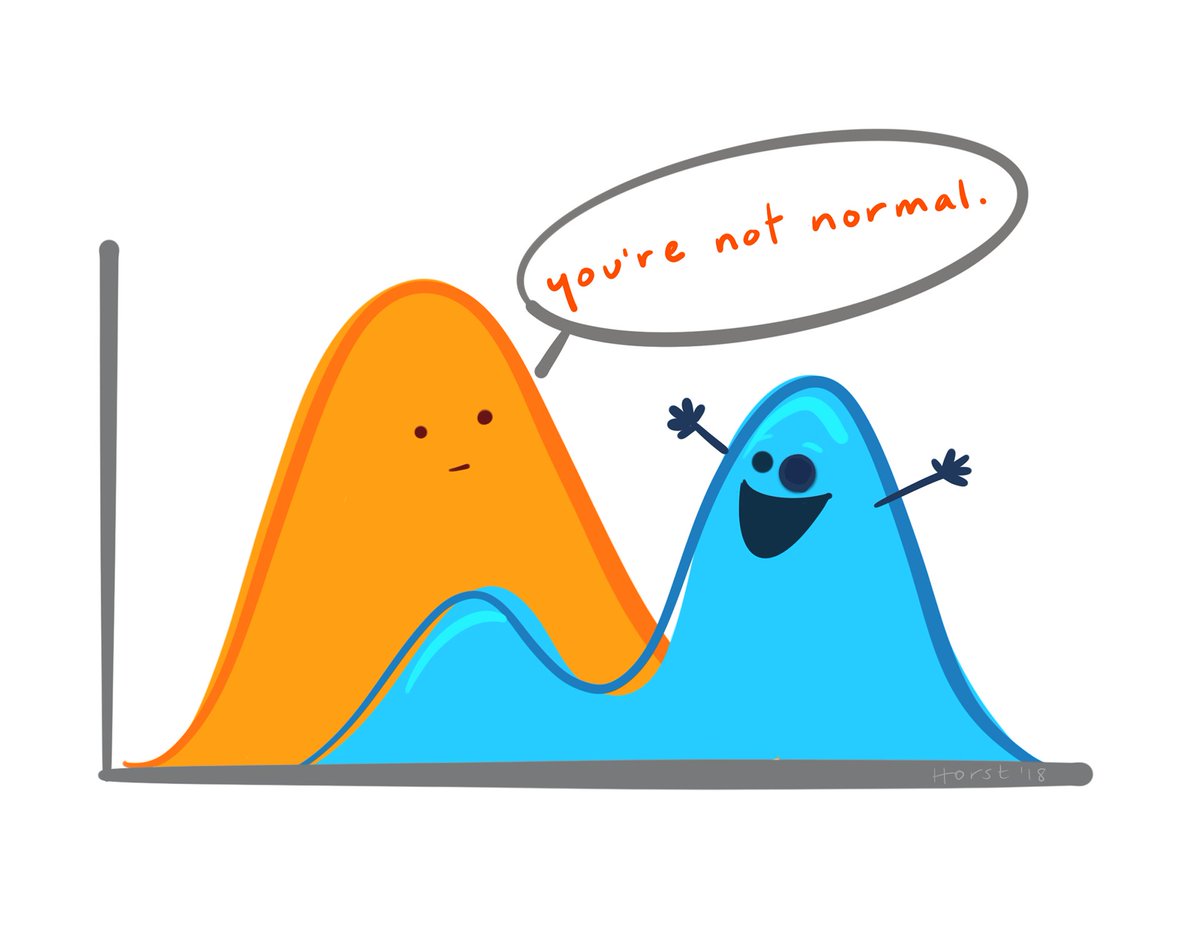
Great shout out 📢 from one of our favorite sites @flowingdata - check out these data science illustrations from recently joined Observable team member @allison_horst
1
6
60
BIG NEWS: Observable is now integrated in #MicrosoftTeams, helping Microsoft customers make better business decisions using data. We are thrilled to be a @msPartner! 🤝 #MSPartner
2
14
59
We sat down with our co-founder @mbostock to discuss the future of data work. Share your thoughts on the topic by using #FutureOfDatawork .
0
12
58
🚨 We're hiring. Open roles at @observablehq.- Designers.- Developer Advocates.- Software Developers.- Data Visualization Developers.
1
18
57
📺 New Video: .Vega-Lite: A Crash Course. See how to build rapid charting and fast explorations of data on @Observablehq from our March meetup with Observable engineer @visnup .#DataVisualization #DataScience #DataViz.🙌.
0
12
56
📢Meetup 8/27: All about D3!.'From Ideation to Interactive Essay with D3' ➡️@wattenberger .'Teaching Visualization Through D3 ' ➡️@mf_viz.Followed up with an AMA from D3 creator & our co-founder @mbostock . some updates on Observable from @mmeckf .📆
1
14
58
Blue Fluorite color palettes. Inspired by @jscarto Data visualization and cartography lead @NASAEarth /
0
10
53
📺 New video series! . Learning Observable: @AnjanaVakil explains core concepts & techniques for working with @ObservableHQ notebooks 📓✨. Watch & Subscribe 👉 More videos coming soon!.
0
7
53
Curious about cartographic coding w/ Turf.js? .Mystified by magic morphing w/ D3 & SVG?.Animated by arty animating w/ Canvas?. Then join us & ambassador @OliviaFVane for a livestream about making wonderful waterline maps! 🌊🗺️✨. Tue July 27 9am PT 📺
0
12
52
Our next meetup is this Thursday, Aug 27! 🎉. This month, it's all about #D3js: @enjalot hosts talks by @Wattenberger & @mf_viz, Q&A with @mbostock & @observablehq updates from @mmeckf!. Details: Bring all your D3 questions, Observable-related or not!.
1
17
49
👋 Goodbye tedious parsing of data files! Observable now supports Microsoft Excel file attachments. @msexcel
1
8
50
Weekly we're updating our Explore page with Staff picks and Featured creators. This week we've added @MAKIO135 notebook and @duto_guerra to staff picks. Thanks for creating on @observablehq !.👀 See all Staff picks and Featured creators here 👉
0
15
53
Do you build in @Matplotlib with #Python? If so, we have the perfect guide for you! Our newest tutorial focuses on making common #Matplotlib charts with Observable Plot - including interactive histograms & scatterplots!
0
15
51
📢 Our next course is here! Advanced Data Visualization: Techniques, Interaction, and Data Patterns led @eagereyes! Join us starting June 13th at 9 AM PT/12 PM ET. Register now and dive into the world of captivating visualizations:
0
8
49
💡Join us TOMORROW for our final session with @allison_horst. We will explore new data wrangling methods, leveraging DuckDB for seamless JS and SQL integration & more. 🎟️ Sign up here:
1
2
22


