

FactSet
@FactSet
Followers
118K
Following
3K
Media
9K
Statuses
23K
We help financial professionals stay ahead of market trends, access company & industry intelligence, monitor portfolio risk and performance, and execute trades.
Worldwide
Joined November 2008
The #coronavirus has dominated the public consciousness and outlook for global companies, particularly in the semiconductor and airline industries.
45
365
3K
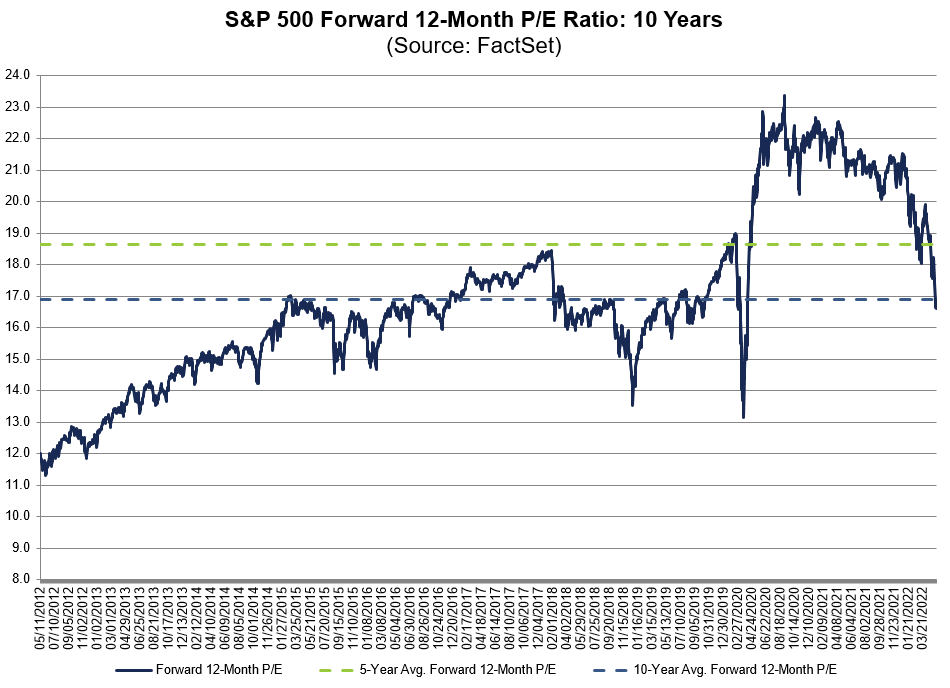
The forward 12-month P/E ratio for $SPX of 16.6 is below the 5-year average (18.6) and below the 10-year average (16.9). #earnings, #earningsinsight,
55
234
1K
The #coronavirus has dominated the public consciousness and outlook for global companies, particularly in the semiconductor and airline industries.
12
115
922
$SPX is reporting a Y/Y earnings decline of -7.3% for Q2 2023, which is the largest decline since Q2 2020 (-31.6%). #earnings, #earningsinsight,

45
179
538
Thematic Indexing 2.0 is a manifestation of the derivative shift to top-down, systematic investing driven primarily by big #data, smart data, and (increasingly) #AI. #thematicinvesting #investing
1
18
473
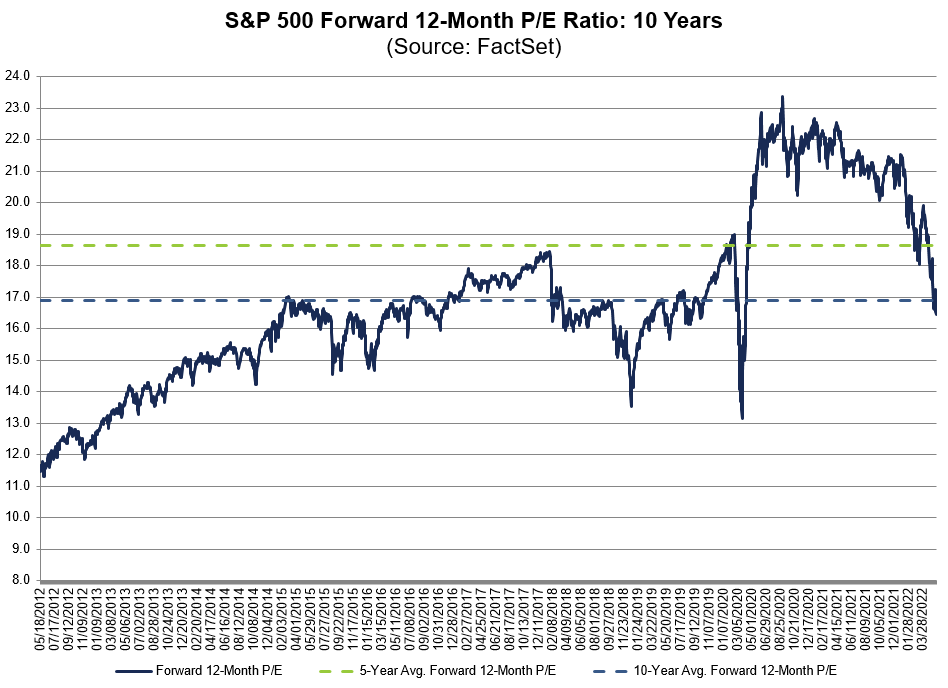
The forward 12-month P/E ratio for $SPX of 16.4 is below the 5-year average (18.6) and below the 10-year average (16.9). #earnings, #earningsinsight,
29
121
490
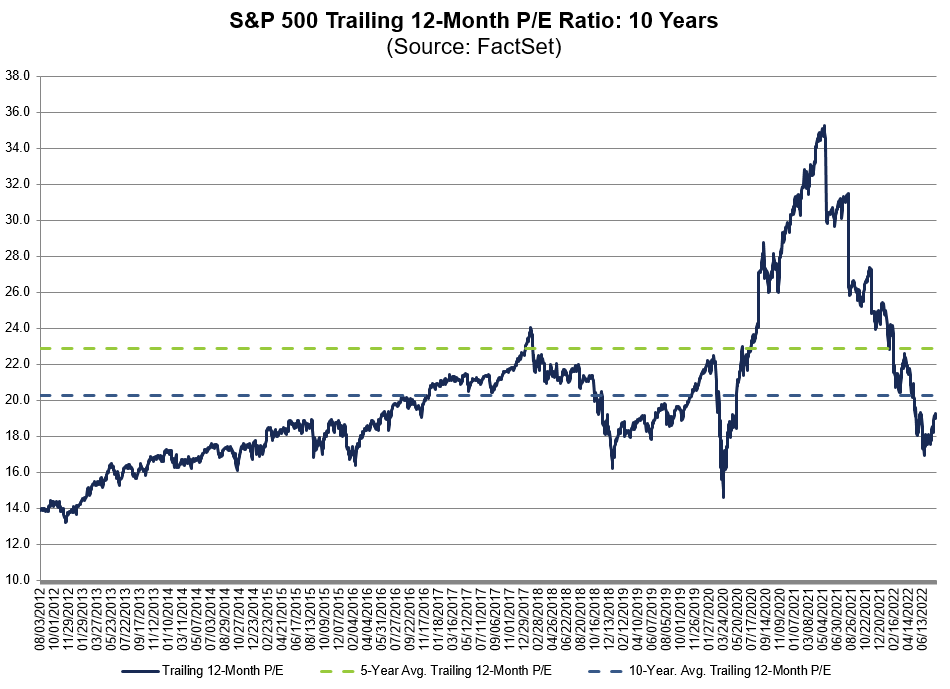
The trailing 12-month P/E ratio for $SPX of 19.1 is below the 5-year average (23.1) and below the 10-year average (20.2). #earnings, #earningsinsight,

16
96
350
The trailing 12-month P/E ratio for $SPX of 18.8 is below the 5-year average (23.1) and below the 10-year average (20.2). #earnings, #earningsinsight,

25
101
350
A full-scale repeal of #DoddFrank requires Congressional action and a replacement plan, which could take years.
59
105
276
China's Travel and Transportation sectors are suffering and the absence of Chinese tourism will have a profound impact globally as travel comprises over 80% of #China’s service imports. Read more: #coronavirus.
9
54
293
Global equity markets saw major selloffs in late January as fear of the spread of the #coronavirus intensified. However, markets have rebounded this month in response to positive developments. Read more: #investing #globalmarkets.
4
42
279
It’s a mistake to use the #SARS outbreak to predict the market impact of the current crisis because the Chinese economy, market dynamics, and geopolitics have changed dramatically since 2003. Read more:#investing #coronavirus #georev.
4
47
279
The forward 12-month P/E ratio for $SPX of 17.6 is below the 5-year average (18.6) but above the 10-year average (16.9). #earnings, #earningsinsight,
7
102
304
80% of $SPX companies have beat EPS estimates to date for Q3, above the 5-year average of 72%.

6
38
263
While equity managers have been incorporating #ESG data into their investment process for years now, fixed-income and credit managers are catching on and finding unique value in ESG data. #sustainbleinvesting.
4
10
263
There’s a growing consensus among fixed-income managers that #ESG research and analysis is fundamental to any rigorous evaluation of a company’s future prospects. #investing #fixedincome.
0
11
256
The forward 12-month P/E ratio for $SPX of 15.8 is below the 5-year average (18.5) and below the 10-year average (17.1). #earnings, #earningsinsight,

34
81
262
The trailing 12-month P/E ratio for $SPX of 21.8 is below the 5-year average (23.1) and above the 10-year average (20.0).

10
82
259
The forward 12-month P/E ratio for $SPX of 20.3 is above the 5-year average (16.7) and above the 10-year average (15.1).

9
121
230
A full-scale repeal of #DoddFrank would require Congressional action and a replacement plan. The options:
38
71
191
The forward 12-month P/E ratio for $SPX of 15.5 is below the 5-year average (18.5) and below the 10-year average (17.1). #earnings, #earningsinsight,

23
86
213
The forward 12-month P/E ratio for $SPX is 18.5, which is above the 5-year average (16.7) and above the 10-year average (15.0).

13
85
206
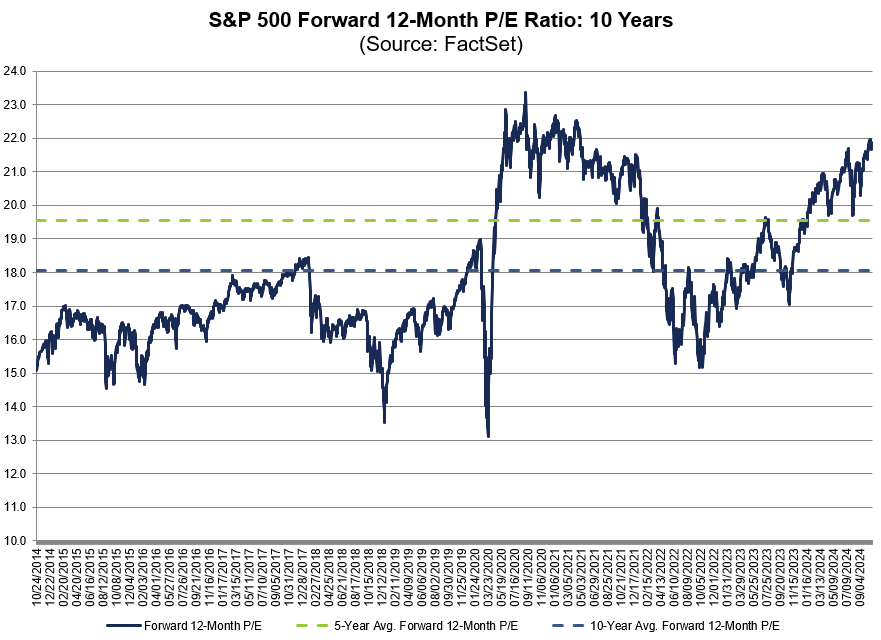
The $SPX forward 12-month P/E ratio is at its highest level (22.2) in more than 3 years. #earnings, #earningsinsight,

4
54
209
The forward 12-month P/E ratio for $SPX of 15.3 is below the 5-year average (18.6) and below the 10-year average (16.9). #earnings, #earningsinsight,

16
53
202
There was a 100% increase in the number of $SPX companies citing "#ESG" on earnings calls in Q2 (24) compared to Q1 (12). #SustainableInvesting

9
43
180
The forward 12-month P/E ratio for $SPX of 17.1 is below the 5-year average (18.6) but above the 10-year average (16.9). #earnings, #earningsinsight,

9
52
191
The trailing 12-month P/E ratio for $SPX of 18.0 is below the 5-year average (22.8) and below the 10-year average (20.4). #earnings, #earningsinsight,

11
52
191
The forward 12-month P/E ratio for $SPX of 17.1 is below the 5-year average (18.7) and below the 10-year average (17.5). #earnings, #earningsinsight,

4
75
189
Since March 31, $SPX forward 12M EPS has declined by 12.7% while $SPX price has increased by 12.7%.

2
97
186
$SPX is expected to report a Y/Y earnings decline of -6.8% for Q2 2023, which would be the largest decline since Q2 2020 (-31.6%). #earnings, #earningsinsight,

5
89
183
Bond markets now put the odds of at least one rate cut by the June #FOMC meeting at 75%. One month ago the odds were just 26%. #Fed #coronavirus #chartoftheweek

3
21
149
The forward 12-month P/E ratio for $SPX of 17.0 is below the 5-year average (18.5) and below the 10-year average (17.2). #earnings, #earningsinsight,

13
42
176
64% of $SPX companies have beaten revenue estimates for Q3 to date, above the 5-year average of 59%.

2
27
147
Excluding the "Magnificent 7" companies, the other 493 $SPX companies are reporting earnings growth of 0.1% for Q3. #earnings, #earningsinsight,

5
60
178
The trailing 12-month P/E ratio for $SPX of 17.0 is below the 5-year average (23.0) and below the 10-year average (20.3). #earnings, #earningsinsight,

9
60
175
The trailing 12-month P/E ratio for $SPX of 19.4 is below the 5-year average (23.1) and below the 10-year average (20.2). #earnings, #earningsinsight,

13
41
163
$SPX is reporting a (Y/Y) decline in earnings of -3.7% for Q3 2019, which would mark the 3rd straight quarter of (Y/Y) earnings declines for the index.

1
31
146
The forward 12-month P/E ratio for $SPX of 16.5 is below the 5-year average (18.5) and below the 10-year average (17.2). #earnings, #earningsinsight,

16
41
161
The trailing 12-month P/E ratio for $SPX of 20.4 is below the 5-year average (22.6) and below the 10-year average (20.6). #earnings, #earningsinsight,

15
37
160
The trailing 12-month P/E ratio for $SPX of 18.9 is below the 5-year average (22.9) and below the 10-year average (20.3). #earnings, #earningsinsight,

12
44
160
$SPX EPS for Q2 has decreased by 36.2% while $SPX price has increased by 16.2% since March 31.

6
84
159
70% of $SPX companies have beaten revenue estimates to date for Q3, which is above the 5-year average of 69% and above the 10-year average of 62%. #earnings, #earningsinsight,

7
62
159
The forward 12-month P/E ratio for $SPX of 19.4 is above the 5-year average (18.6) and above the 10-year average (17.4). #earnings, #earningsinsight,

7
58
162
$SPX is reporting a (Y/Y) decline in earnings of -2.7% for Q3 2019, which would mark the 3rd straight quarter of (Y/Y) earnings declines for the index.

10
95
148
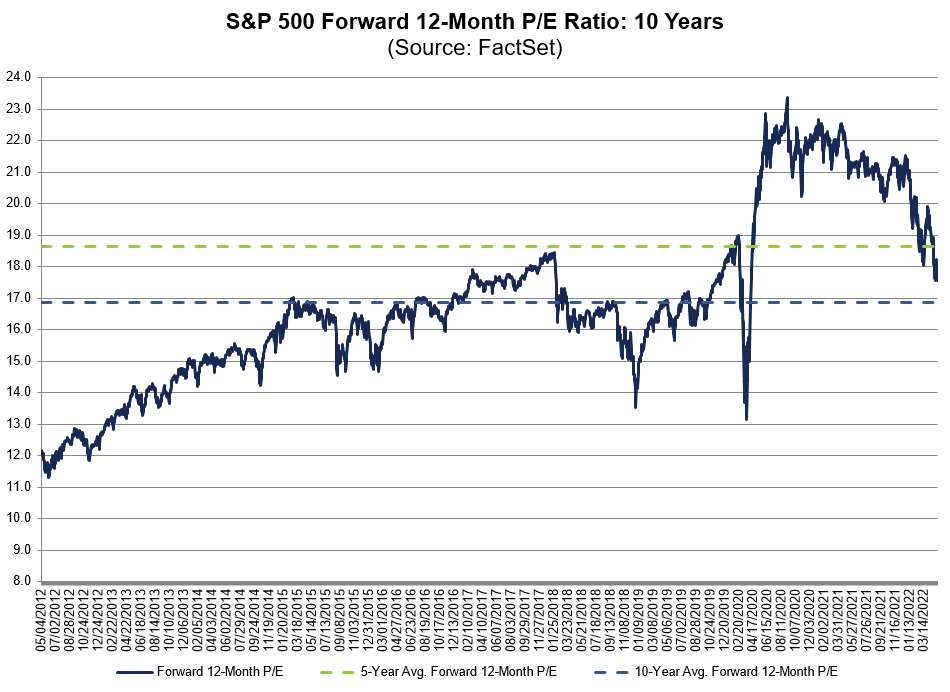
The forward 12-month P/E ratio for $SPX of 16.4 is below the 5-year average (18.6) and below the 10-year average (17.0). #earnings, #earningsinsight,

17
52
160
The forward 12-month P/E ratio for $SPX of 15.4 is below the 5-year average (18.6) and below the 10-year average (17.1). #earnings, #earningsinsight,

11
50
155
The forward 12-month P/E ratio for $SPX of 16.8 is below the 5-year average (18.6) and below the 10-year average (17.0). #earnings, #earningsinsight,

14
64
155
The trailing 12-month P/E ratio for $SPX of 17.5 is below the 5-year average (22.9) and below the 10-year average (20.4). #earnings, #earningsinsight,

15
54
152
The trailing 12-month P/E ratio for $SPX of 19.3 is below the 5-year average (22.9) and below the 10-year average (20.3). #earnings, #earningsinsight,
10
44
150
$SPX is reporting Y/Y earnings growth of 4.8% for Q2 2022, which is the lowest growth since Q4 2020 (4.0%). #earnings, #earningsinsight,

1
28
154
It is no longer enough to only capture #volatility within risk modeling, but rather, risk modeling needs to capture market turbulence, which is loosely defined as the volatility of volatility. Read more on: #RiskManagement

17
37
130
The forward 12-month P/E ratio for $SPX of 19.3 is above the 5-year average (18.8) and above the 10-year average (17.6). #earnings, #earningsinsight,

4
52
155
$SPX is expected to report a Y/Y earnings decline of -6.6% for Q1 2023, which would be the largest decline since Q2 2020 (-31.8%). #earnings, #earningsinsight,

8
56
146
The trailing 12-month P/E ratio for $SPX of 28.7 is above the 5-year average (24.1) and above the 10-year average (21.9). #earnings, #earningsinsight,

2
25
153
The forward 12-month P/E ratio for $SPX of 16.3 is below the 5-year average (18.5) and below the 10-year average (17.1). #earnings, #earningsinsight,

9
46
146
The forward 12-month P/E ratio for $SPX of 19.5 is above the 5-year average (18.6) and above the 10-year average (17.4). #earnings, #earningsinsight,

5
51
147
The forward 12-month P/E ratio for $SPX of 18.4 is below the 5-year average (18.5) but above the 10-year average (17.2). #earnings, #earningsinsight,

13
44
149
The trailing 12-month P/E ratio for $SPX of 17.6 is below the 5-year average (23.0) and below the 10-year average (20.3). #earnings, #earningsinsight,

6
36
146
66 $SPX companies have issued negative EPS guidance for Q1 2022, which is the highest number since Q4 2019 (73). #earnings, #earningsinsight,

3
58
144
$SPX EPS estimate for Q2 declined by 28.4% in April while $SPX price increased by 12.7% during the same period.

5
70
138
$SPX is reporting a Y/Y earnings decline of -5.2% for Q2 2023, which is the largest decline since Q3 2020 (-5.7%). #earnings, #earningsinsight,

0
60
138
The forward 12-month P/E ratio for $SPX of 16.3 is below the 5-year average (18.6) and below the 10-year average (17.0). #earnings, #earningsinsight,

4
47
142
The trailing 12-month P/E ratio for $SPX of 29.3 is well above the 5-year average (20.7) and well above the 10-year average (18.2).

6
57
141
The forward 12-month P/E ratio for $SPX of 21.9 is above the 5-year average (19.5) and above the 10-year average (18.1). #earnings, #earningsinsight,

6
51
145
The forward 12-month P/E ratio for $SPX of 15.8 is below the 5-year average (18.6) and below the 10-year average (16.9). #earnings, #earningsinsight,

9
32
137
The forward 12-month P/E ratio for $SPX of 15.6 is below the 5-year average (18.5) and below the 10-year average (17.1). #earnings, #earningsinsight,

7
43
132
The trailing 12-month P/E ratio for $SPX of 23.2 is above the 5-year average (22.6) and above the 10-year average (20.8). #earnings, #earningsinsight,

10
44
139
The forward 12-month P/E ratio for $SPX of 20.6 is above the 5-year average (19.4) and above the 10-year average (18.0). #earnings, #earningsinsight,

2
43
139
The forward 12-month P/E ratio for $SPX of 21.5 is above the 5-year average (19.7) and above the 10-year average (18.2). #earnings, #earningsinsight,

5
47
138
The forward 12-month P/E ratio for $SPX of 20.5 is above the 5-year average (19.2) and above the 10-year average (17.8). #earnings, #earningsinsight,

7
42
132
The trailing 12-month P/E ratio for $SPX of 18.6 is below the 5-year average (23.0) and below the 10-year average (20.3). #earnings, #earningsinsight,

7
47
132
The forward 12-month P/E ratio for $SPX of 18.0 is below the 5-year average (18.5) but above the 10-year average (17.3). #earnings, #earningsinsight,

9
39
130
The trailing 12-month P/E ratio for $SPX of 18.9 is below the 5-year average (22.9) and below the 10-year average (20.3). #earnings, #earningsinsight,

6
34
126
From Jan. 3 though May 12, the price of the $SPX declined by 17.5% while the forward 12-month EPS estimate increased by 6.1%.

0
24
128
The forward 12-month P/E ratio for $SPX of 17.3 is below the 5-year average (18.5) but above the 10-year average (17.2). #earnings, #earningsinsight,

7
30
128
The forward 12-month P/E ratio for $SPX of 15.8 is below the 5-year average (18.6) and below the 10-year average (16.9). #earnings, #earningsinsight,

12
32
127
The trailing 12-month P/E ratio for $SPX of 18.1 is below the 5-year average (23.1) and below the 10-year average (20.2). #earnings, #earningsinsight,

1
32
123
The forward 12-month P/E ratio for $SPX of 19.2 is above the 5-year average (18.6) and above the 10-year average (17.4). #earnings, #earningsinsight,

4
58
124
The trailing 12-month P/E ratio for $SPX of 17.6 is below the 5-year average (22.8) and below the 10-year average (20.4). #earnings, #earningsinsight,

7
34
128
The forward 12-month P/E ratio for $SPX of 22.0 is above the 5-year average (19.6) and above the 10-year average (18.1). #earnings, #earningsinsight,

2
45
129
The trailing 12-month P/E ratio for $SPX of 18.6 is below the 5-year average (22.7) and below the 10-year average (20.5). #earnings, #earningsinsight,

6
34
123
$SPX companies appear less confident today that policies proposed by Pres. Trump will be enacted in the near future.
27
35
107
68% of $SPX companies have beaten EPS estimates to date for Q2 2022, which is the lowest % since Q1 2020 (63%). #earnings, #earningsinsight,

1
46
126
The trailing 12-month P/E ratio for $SPX of 17.6 is below the 5-year average (23.0) and below the 10-year average (20.3). #earnings, #earningsinsight,

9
50
124
The forward 12-month P/E ratio for $SPX of 21.7 is above the 5-year average (19.6) and above the 10-year average (18.1). #earnings, #earningsinsight,
3
35
124
The trailing 12-month P/E ratio for $SPX of 19.8 is below the 5-year average (22.8) and below the 10-year average (20.5). #earnings, #earningsinsight,

12
23
118
The forward 12-month P/E ratio for $SPX of 19.2 is above the 5-year average (18.5) and the 10-year average (16.7).

4
35
121
The trailing 12-month P/E ratio for $SPX of 19.1 is below the 5-year average (22.7) and below the 10-year average (20.5). #earnings, #earningsinsight,

13
19
120
The forward 12-month P/E ratio for $SPX of 22.3 is above the 5-year average (19.7) and above the 10-year average (18.1). #earnings, #earningsinsight,

4
44
123
The forward 12-month P/E ratio for $SPX of 20.9 is above the 5-year average (19.0) and above the 10-year average (17.7). #earnings, #earningsinsight,

3
45
112
$SPX is reporting Y/Y revenue growth of 10.9% for Q2 2022, which is the 6th straight quarter of double-digit growth. #earnings, #earningsinsight,

1
25
118
While #HNWIs want to consider #ESG as part of their investment portfolio, they are still looking for a good return on their investment. Learn more: #investing #wealthmanagement #sustainableinvesting.
5
19
103
The forward 12-month P/E ratio for $SPX of 20.3 is above the 5-year average (19.2) and above the 10-year average (17.8). #earnings, #earningsinsight,

2
50
119