
DebugBear
@DebugBear
Followers
2K
Following
516
Statuses
1K
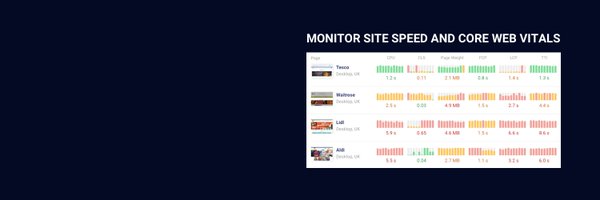
Monitor page speed and Core Web Vitals in the lab and with real user data.
London, England
Joined July 2018
We've built a FREE site speed testing tool. Check if your website meets Google's Core Web Vitals and see what you can do to make it load faster. Test your website here 🚀
11
51
173
Are image downloads causing poor Largest Contentful Paint scores on your website? Check if the LCP Resource Load Duration is high on your website. Here's a new post about what causes high load duration, how to measure it in different tools, and what you can do to fix it!
0
1
2
RT @nucliweb: Avoid marking too many requests as high priority - "If all resources are a priority, none is a priority" Selectively use the…
0
1
0
Preloading web fonts can help you site load faster and reduce layout shift. 📚 Understand how web fonts impact performance 🛜 Set up preload tags to load fonts early ⚠️ Pick the right set of fonts to preload
0
1
1
Early Hints are a great trick to speed up your website if you don't have a fast server response time! 🚀 Normally browsers browsers will just sit there waiting for the HTML... but with Early Hints that time can be used to load important resources like CSS and fonts!

0
0
2
We've been doing some work tidying up the page view details UI in our RUM product! Get a quick overview of how well you're doing and then deep dive into specific scripts dragging down your INP scores.

0
0
0
What can understanding the critical rendering path tell you about how to optimize your website speed? ‼️ Find out what resources are critical 🎨 See the role of rendering in the critical path 🛜 Optimize resources on your website
0
1
1
We've got a new video out all about investigating fascinating edge cases when measuring the Largest Contentful Paint metric! Learn what "contentful" really means and how LCP implementations differ across browsers.
0
0
1
🌎 The speed of your phone and internet connection has a big impact on how fast websites will load for you! We took at look at some of the countries where page speed is fastest and slowest.

0
2
3
Web fonts can slow down your website, especially if they completely prevent text from appearing until the font is loaded! In this article we explain how web fonts cause page speed and how you can use the font-display:swap CSS declaration to ensure text shows up quickly.
0
0
0
DebugBear product updates for January: 🏡 New Lighthouse and Chrome versions 📊 Better RUM breakdown data 🌎 Free global TTFB test 📽️ New videos and articles
0
0
2
Are articles with 20 tips to optimize your website performance helpful? This new posts instead looks at two other approaches: 🏡 Running automated auditing tools 🛶 Investigating request waterfalls
0
0
3
New video: a web performance audit of the Waitrose homepage! 🚀 103 Early Hints 💂 A big HTML response 😴 A lazy loaded LCP image 📲 Slow back/forward navigations
0
2
5
We wrote a guide on how to fix INP issues on your website! Use real user monitoring data to identify slow pages, UI elements with poor INP, and specific scripts that slow down your website.
0
2
5
Poor First Contentful Paint scores indicate that website visitors are waiting a long time for the page to load. Do you know how to fix these issues? We've just published a video with practical examples on how to investigate poor First Contentful Paint.
0
2
2
Need to audit the Core Web Vitals of your website and not sure where to start? Check out our new blog post: 💪 Define a strong foundation 📊 Assess current performance 🚀 Audit LCP, CLS, and INP 📈 Prioritize optimizations
0
2
3
Not sure how to fix Cumulative Layout Shift issues on your website? This guide shows three concrete examples of how to identify the cause of CLS and apply a solution.
0
1
3
Is loading large amounts of unused CSS code making your visitors wait longer for your website to load? Our new article explains the impact of unused CSS, and looks at tools like the DevTools Coverage tab and Lighthouse that you can use to minimize it.
1
0
7
A web performance problem that's surprisingly common: Web fonts embedded in a CSS file! This stylesheet contains 17 fonts 🤯 Embedding these fonts in CSS means the fonts become render blocking, slowing down your page load.

0
0
3
What does network latency mean for page speed? 🌎 See how global data transfer impacts latency 🚀 Learn how Content Delivery Networks reduce latency 📊 Check how latency is impacting user experience
0
1
1
How fast do websites load in 2025? We took a look at data from Google's Chrome User Experience Report to find out!
0
0
3