
CO2_Earth
@CO2_earth
Followers
33,493
Following
12,130
Media
3,423
Statuses
7,286
Real-time, global signal for living well on Earth #CO2 #energy #green #solutions #sustainability Posts by Michael McGee b. 318 ppm, creator of .
The Atmosphere @ 3400 Metres
Joined June 2009
Don't wanna be here?
Send us removal request.
Explore trending content on Musk Viewer
Florida
• 253157 Tweets
Bivol
• 123908 Tweets
Oregon
• 81369 Tweets
#AEWWrestleDream
• 67129 Tweets
Nico
• 65508 Tweets
Hiro
• 55009 Tweets
Ohio State
• 44735 Tweets
Howard
• 41870 Tweets
Tennessee
• 39577 Tweets
Dennis Quaid
• 36403 Tweets
#ブンブンジャー
• 30102 Tweets
Valencia
• 27236 Tweets
ワコール
• 25639 Tweets
#MostRequestedLive
• 25201 Tweets
#UFCVegas98
• 24697 Tweets
GALA EN PAPIS
• 20748 Tweets
Kentucky
• 19360 Tweets
いろはちゃん
• 16169 Tweets
まゆちゃん
• 15463 Tweets
Saint Dr MSG Insan
• 13515 Tweets
イッテQ
• 13446 Tweets
Ole Miss
• 13156 Tweets
ヴァレン
• 12124 Tweets
Buckeyes
• 11495 Tweets
マッドレックス様
• 10959 Tweets
Ryan Day
• 10854 Tweets


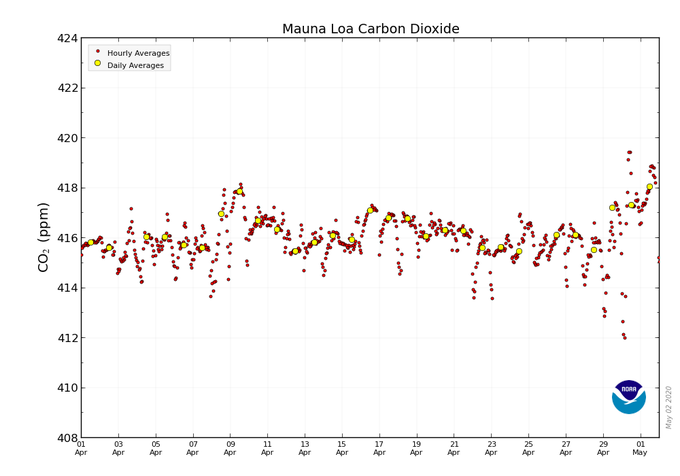
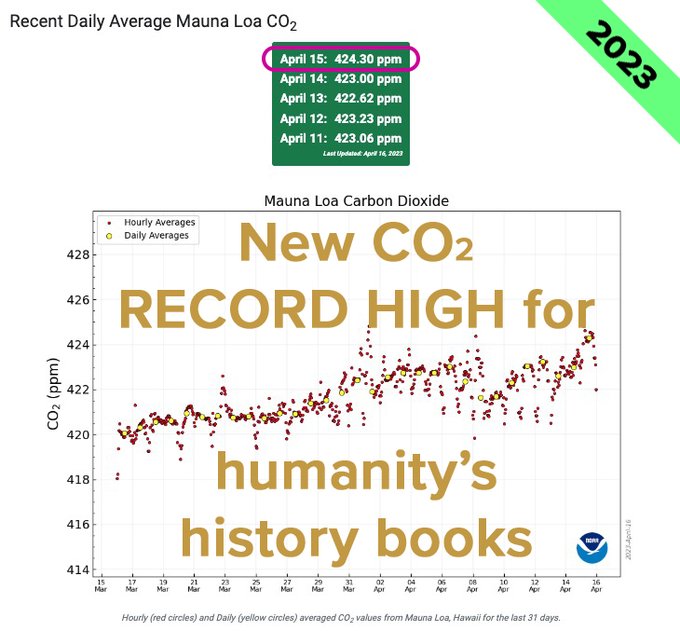
🌍 🏆📈 Atmospheric CO2 just hit the HIGHEST EVER level IN HUMAN HISTORY at Mauna Loa 🏆😰 423.01 ppm on Apr 6 2023 😰🏆 Up 3.84 ppm from 419.17 one year ago 😰
@NOAA
live data: 🌍 Track records @ 🌍

168
862
1K


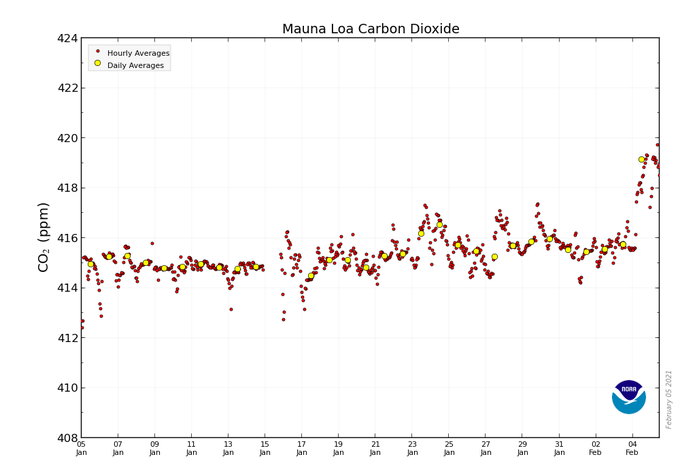
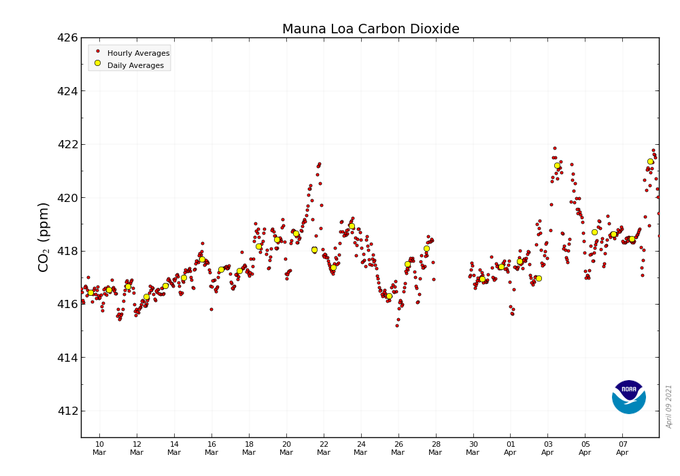
🏆📈🏆 421.36 ppm
#CO2
in Earth’s atmosphere on April 8, 2021 🏆 HIGHEST EVER daily average at the Mauna Loa Observatory 🏆 Up from 416.96 ppm a year ago 🏆
#NOAA
source: 🏆 records: 🌍😰
#EarthSaysOuch
😰🌍
35
437
896

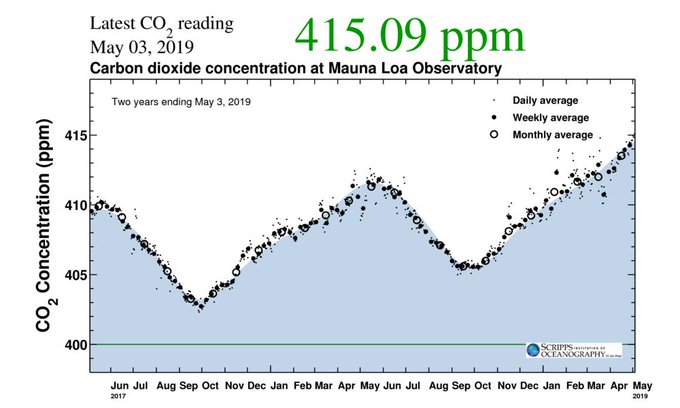
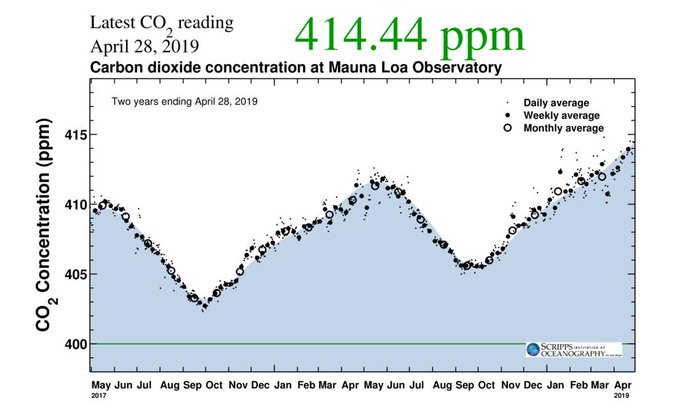
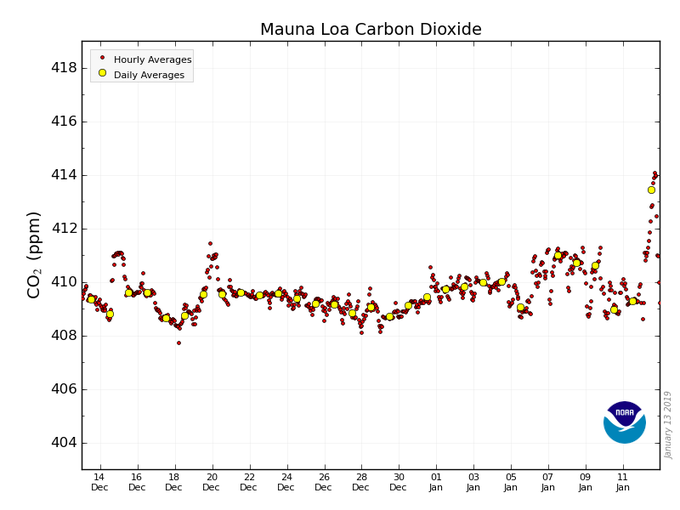
🏆📈🏆 Humanity's FIRST DAY EVER with
#CO2
in air > 415 ppm at Mauna Loa 🏆 415.09 ppm CO2 on May 3, 2019 🏆
@keeling_curve
source: 🏆 Records tracked at 🙏
#MayThe4thBeWithYou
🙏
58
1K
879
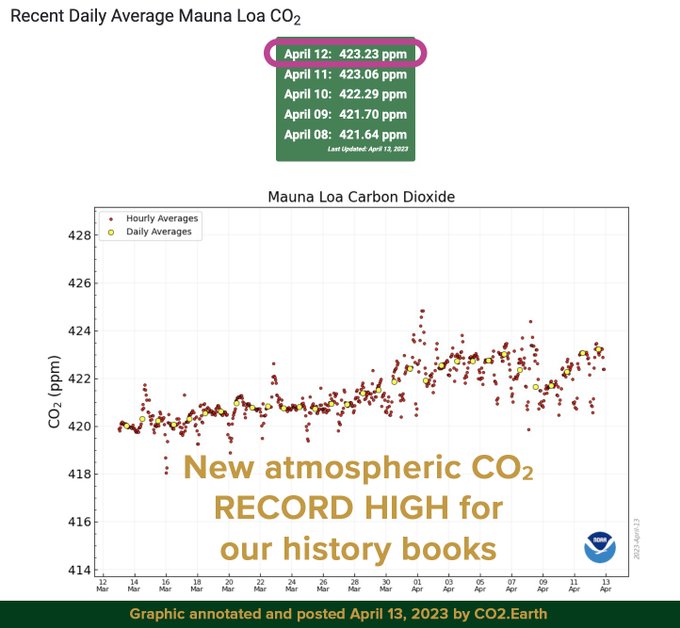
🌍 🏆📈 Atmospheric CO2 just hit another RECORD HIGH at Mauna Loa 🏆😰 423.23 ppm on Apr 12 2023 😰🏆 😰 Third new RECORD this week! 😰 Up 4.24 ppm from 418.99 one year ago 😰 Daily data live from
@NOAA
🌍 🙏 Track records 🙏 🌍
79
444
887

OK,
@GretaThunberg
. No more mamsy pamsy "climate change" talk. 🏁We just passed 415 ppm
#CO2
. 🏁 It's time for change. 📢 So, hello
#ClimateBreakdown
. 📢 Hello
#EcologicalBreakdown
. 📢 Hello
#ClimateDisruption
! Status quo words support status quo inaction. 🐢

It’s 2019. Can we all now please stop saying “climate change” and instead call it what it is: climate breakdown, climate crisis, climate emergency, ecological breakdown, ecological crisis and ecological emergency?
#ClimateBreakdown
#EcologicalBreakdown
2K
20K
59K
14
272
795


Highest 1-day
#CO2
average at Mauna Loa for 2019 was probably 415.70 ppm on May 15, 2019, as reported by
@Keeling_curve
#Scripps
#UCSD
[See ] If a higher reading comes in by 2020,
will mark the new record at .

Have we just seen the peak daily CO2 concentration for 2019? Hopefully yes, but it’s still possible we’ll see even higher values. 2002 peaked on May 27, 2006 May 24 and 2013 May 26. Data: . Daily updates at

2
24
35
7
167
325

📈 415.39 parts per million (ppm)
#CO2
in the atmosphere on May 16, 2019 📈
#Scripps
#UCSD
@Keeling_curve
data & graphic for Mauna Loa: 📈 Also view daily updates at

11
164
294
🥉📈🥉 414.62 ppm
#CO2
in Earth’s atmosphere April 29, 2019🥉 3rd HIGHEST EVER daily average at Mauna Loa 🥉 🔗
@keeling_curve
source: 🏆 See records at 👥👥 Cap the warming at 1.5ºC by cutting global emissions 45% by 2030 🙏

14
212
280
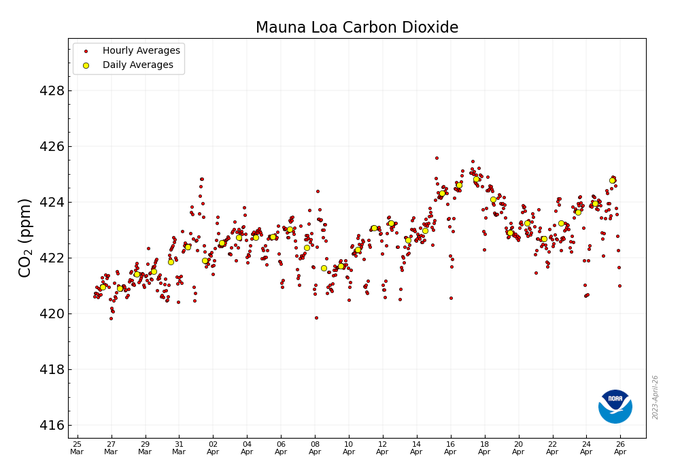
🏆🏆 Atmospheric
#CO2
just hit a NEW RECORD HIGH for the HUMAN ERA of 428.63 PPM on Apr 26. 🏆 🏆 📈 See the latest Mauna Loa data from Scripps @ 📈 🌍 Tune into levels at & 🌍

42
221
302


Today, Scripps reported its largest one year jump of 4.7 ppm in monthly average CO2 at Mauna Loa (Mar 24 v Mar 23). Dr Ralph Keeling commented that climate ”stabilization will require that CO2 levels start to fall. Instead, CO2 is rising faster than ever.”

29
191
265
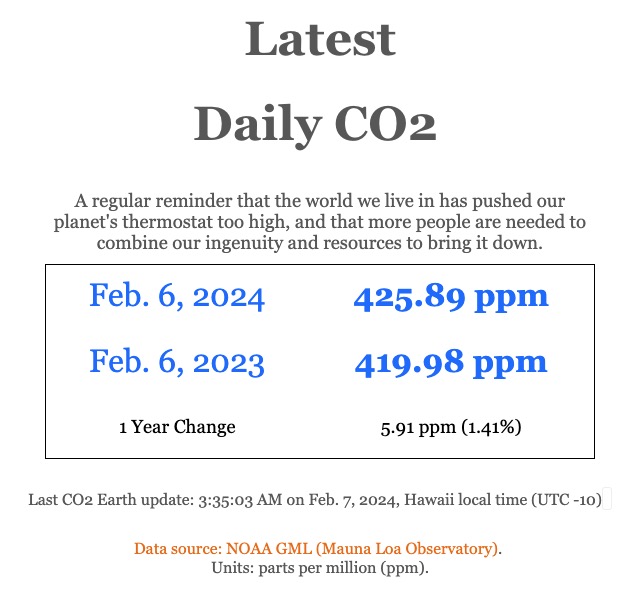
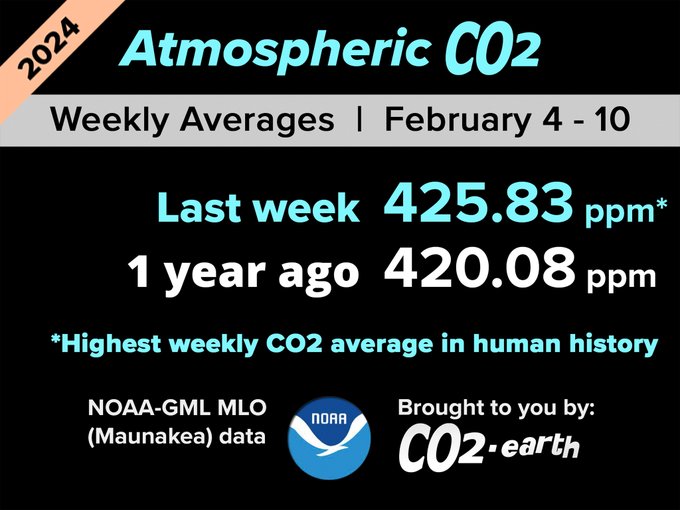
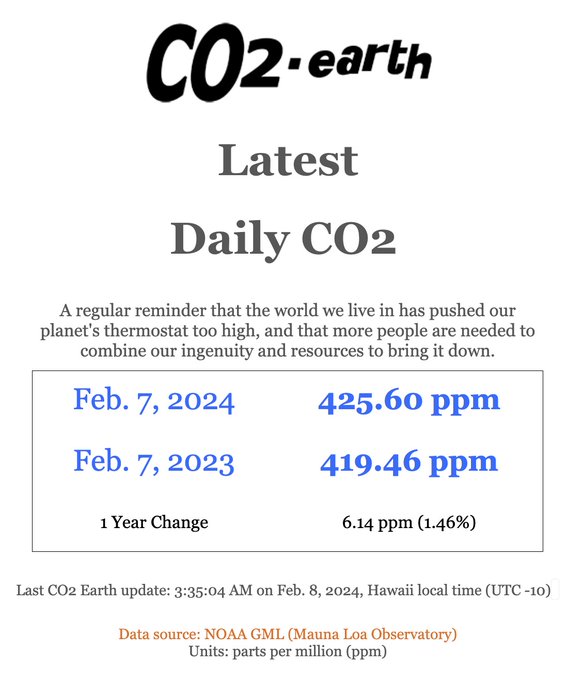
🏆📈🏆 426.50 ppm
#CO2
in Earth’s atmosphere February 3, 2024 🏆 HIGHEST daily average recorded at Mauna Loa in human history 🏆
#Scripps
@Keeling_curve
data & graphic: 🏆 Daily records:


426.50 parts per million (ppm) CO2 in air 03-Feb-2024
10
49
68
14
214
255


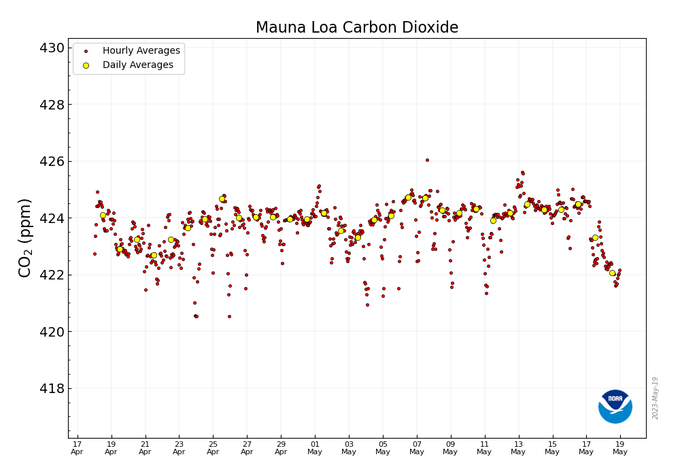
🌍📈 🏆 Just in time for
#EarthWeek
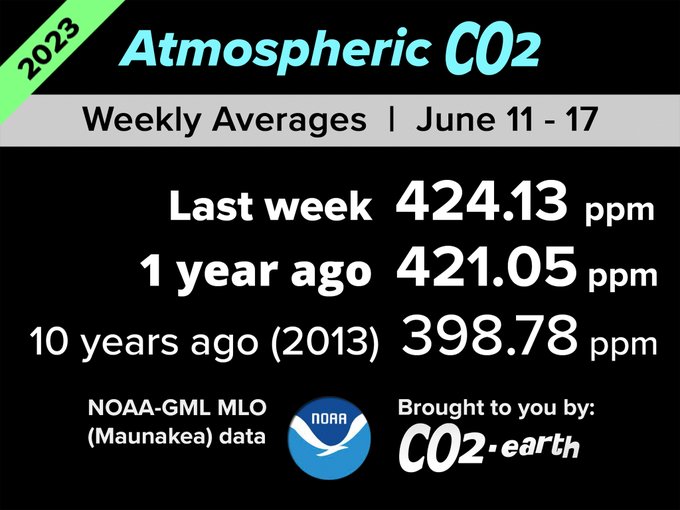
we broke the RECORD HIGH for the WEEKLY CO2 AVERAGE 😰 422.89 ppm
#CO2
at Mauna Loa in the 15th week of 2023 🏆 Up 2.99 from 419.90 a year ago 😰
@NOAA
data: 🌍 records: 🌍

30
113
153


🌍 🏆📈 Atmospheric CO2 just hit an ALL TIME RECORD HIGH at Mauna Loa 🏆😰 423.06 ppm on Apr 11 2023 😰🏆 Up 4.24 ppm from 418.82 one year ago 😰 Daily data live from the
@NOAA
: 🌍 🙏 Track records: 🙏 🌍

7
105
143

May
#2021
be a watershed year when people at all levels of our societies get comfortable (as
@GretaThunberg
is) with knowing the problem (biosphere getting less habitable) and calling on the need to modify systems that perpetuate it. Lives, liberties & legacies are at stake.
My name is Greta Thunberg and I am inviting you to be a part of the solution.
As
#ParisAgreement
turns 5, our leaders present their 'hopeful' distant hypothetical targets, 'net zero' loopholes and empty promises.
But the real hope comes from the people.
#FightFor1Point5
9K
15K
67K
4
34
133


@pawelroszyk
@NOAA
The location at 3400 m in the middle of the largest ocean is well established as an outstanding location for getting air samples with clean background air.
5
3
130
@Claudiokollera
@NOAA
Actually, the atmosphere, land surface and oceans are capturing more CO2 than they used to, say, a decade or a century ago. But the removal of massive amounts of C sequestered in the Earth's crust is forcing a cascade of changes through the climate system and biosphere.
8
16
124

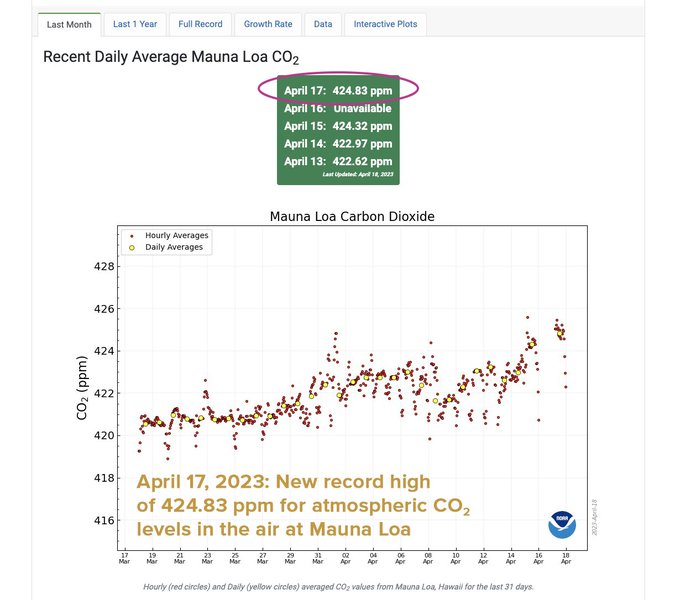
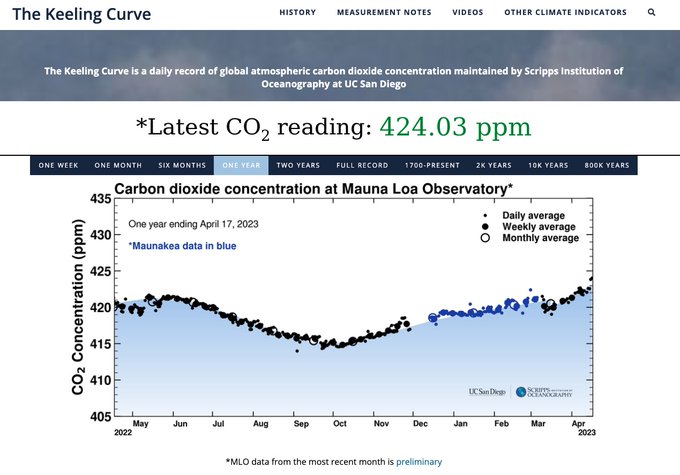
424.03 parts per million (ppm) CO2 in air 16-Apr-2023. First >424 reading in Keeling Curve record. Highest recorded reading at Mauna Loa Observatory.

25
94
126
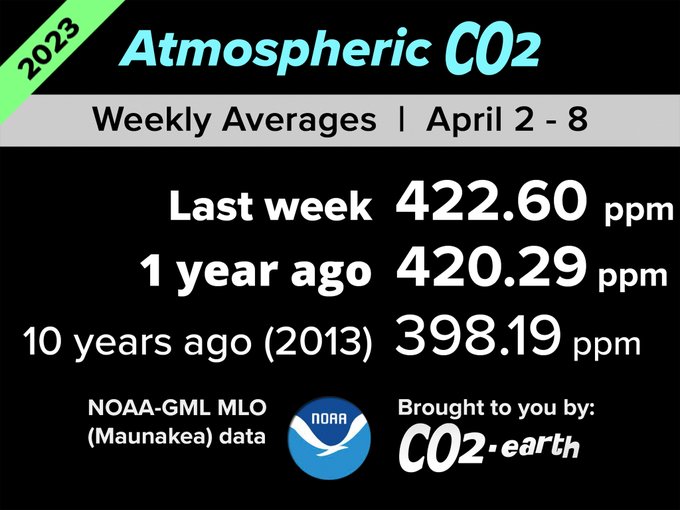
🌍 🏆📈 Humankind broke a new ALL-TIME record in the WEEKLY CO2 AVERAGE in the 14th week of 2023 🏆😰 422.60 ppm at Mauna Loa 😰🏆 Up 2.31 ppm from 420.29 a year ago 😰
@NOAA
live data: 🌍 Track records: 🌍
6
103
121


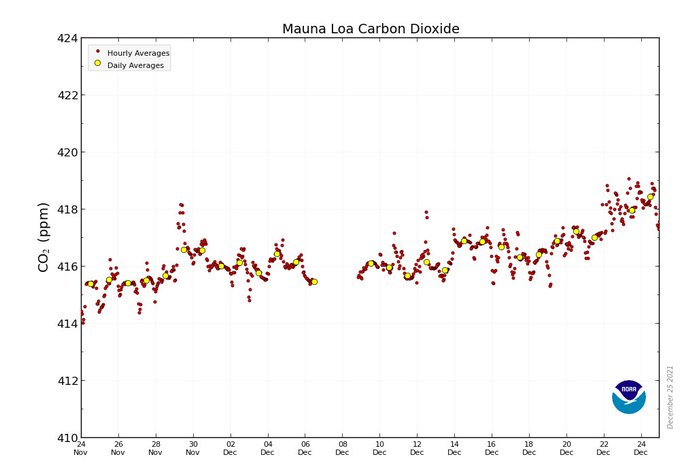
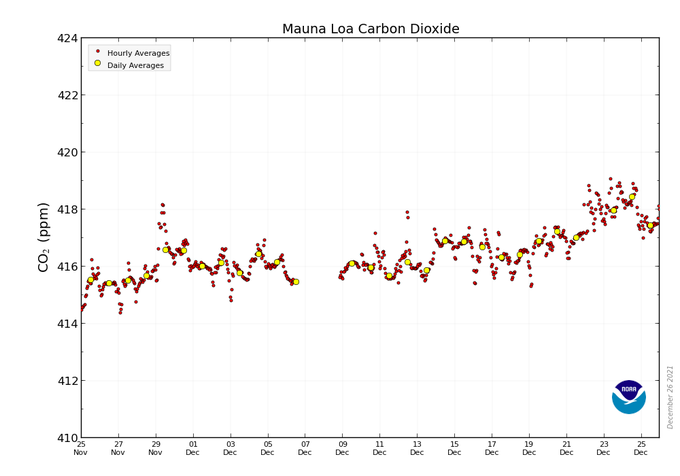
📈 417.44 ppm
#CO2
in the atmosphere December 25, 2021 📈 Up 2.63 ppm from 414.81 ppm the previous
#Christmas
day 📈 Mauna Loa Observatory
@NOAA
data & graphic: 📈 tracking: 🙏 View & share often 🙏
4
67
109

In historic move, Vermont becomes 1st state to pass law requiring fossil fuel companies to pay for climate change damages via
@CBSNews

4
54
112


📈424.03 ppm
#CO2
in the atmosphere on Apr 16 2023 📈 Up 2.72 from 421.31 ppm one year ago @ Mauna Loa 📈
@Scripps_Ocean
@Keeling_curve
data 📈 updates 📈🚫
@NOAA
MLO CO2 data unavailable for Apr 16 2023 🚫
27
58
106


🏆📈🏆 NEW RECORD HIGH FOR WEEKLY CO2 🏆📈🏆
🌎 427.94 ppm
#CO2
in the Earth's air in the 17th week of 2024
🌎 That's up from 423.96 a year ago
🌎 NOAA Mauna Loa data
🌎 Share data &

4
81
97