

Econovis
@econovisuals
Followers
3K
Following
2K
Media
1K
Statuses
2K
Economic Research, Analysis, and Visualization Global Economy, Markets, and Trade | Finance | Money Supply
Global
Joined June 2023
The Global Money Supply Monitor (#GMSM) aims to track, analyze, and monitor global money supply trends across economies, elucidating their relationship with the broader economy and financial markets. Comprehensive coverage spanning 169 countries. 👇👇👇.
2
9
35
📈 China Leads Global Goods Exports: $3.4 Trillion in 2023 vs. EU's $2.8 Trillion and U.S.'s $2.0 Trillion. From 2000 to 2023, China's goods exports soared from $0.25 trillion to $3.38 trillion, marking an exceptional compound annual growth rate (CAGR) of 12.0%. In comparison,

1
21
31
📈 China's Crude Oil Import Sources in 2024. China's crude oil imports have surged from 1.4 million barrels per day (bpd) in 2000 to an unprecedented 11.1 million bpd in 2024, solidifying its position as the world’s largest importer with a 23% share of global imports in 2023. GCC

1
14
27
📈 Crude Oil Production Value as a Share of Global GDP (1973–2024). In 2023, crude oil production value accounted for 2.3% of global GDP, with an estimated 2.2% in 2024, both below the long-term average of 2.6% (2000–2023). This lower ratio reflects relatively subdued oil prices.

0
10
23
📈 U.S. $57 Billion Fuels Trade Surplus in 2023 vs. EU $455 Billion Deficit and China's $435 Deficit. The following key trends are highlighted:. United States:.Historically had a fuels trade deficit, which began improving significantly after the Shale Revolution in the 2010s. By

1
11
23
📈 U.S. Real M2 Money Supply Growth Turns Positive After 28-Month Decline. After 28 consecutive months of contraction, the U.S. real M2 money supply—M2 adjusted for inflation—returned to positive growth in June 2024. By December 2024, year-over-year growth had reached 1.0%,

0
7
23
📈 EU Exports to 'Connector' CIS Countries Double Since Russia's Invasion of Ukraine. The Russian invasion of Ukraine on February 24, 2022, triggered European Union sanctions against Russia. As a result, EU exports to Russia dropped sharply, from €89 billion in 2021 to €38

0
11
22
📈 The Market Cap of the Rest of the Magnificent Seven and S&P 500 Hold Steady on January 27, 2025, as Nvidia’s Nosedives. On January 27, 2025, Nvidia's market capitalization plummeted by 17%, dropping from $3.5 trillion to $2.9 trillion in a single day—a record $590 billion

0
6
20

📈 U.S. M2 Money Supply Growth Rebounds. Following 19 consecutive months of contraction, U.S. M2 money supply growth turned positive in November 2023. By December 2024, it had risen to 3.9% year-over-year and 0.87% month-over-month. However, this remains below the long-term

1
3
19

📈 Fields Medal for Mathematics by Nations (1936-2022). The Fields Medal is awarded to two, three, or four mathematicians under 40 years of age every four years during the International Congress of Mathematicians. Its purpose is to recognize outstanding mathematical achievement

0
10
17
📈 S&P 500 Reaches Record $54.3 Trillion, Gaining $1.1 Trillion After Trump Inauguration. The S&P 500 market capitalization climbed by $1.1 trillion (+2.0%) between January 21–23, 2025, hitting a historic high of $54.3 trillion. The surge followed Donald Trump's inauguration,

0
4
18
📈 House Prices Across U.S. States (July 2024). Median Listing Prices by State (Seller-Listed Prices, Thousand US$). #USA #economy #house #housing #propertymarket #property #realestate #residential #housingcrisis #homeowners #housingaffordability #affordability #renters

2
5
18
📈 U.S. Buffett Indicator in Q2 2024. U.S. Stock Market Capitalization to GDP Ratio Reaches 196% in Q2 2024. #USA #markets #marketcapitlization #GDP #asset #equity #equities #SP500 #SPX #SPY #stock #stockmarket #finance #investing #investment #investor #Bitcoin #crypto #gold

2
6
17
📈 Despite Exports Restriction to China, ASML will Growth Due to Huge Investments in the U.S. In the year ending July 2024, over $120 billion was invested in U.S. construction for advanced chip manufacturing facilities, driving future demand for chip-making machinery. ASML,

0
7
18
📈 EU Car Exports to China Decline, While Imports from China Surge Sharply. As of September 2024 (TTM), EU car exports to China totaled €12.8 billion, while imports from China surged to €16.2 billion. After a spike in the early 2010s, EU car exports to China had remained

0
8
17
📈 Global Goods Trade Leaders in 2023: China at $5.9 Trillion, EU at $5.5 Trillion, U.S. at $5.2 Trillion. From 2000 to 2023, China's total goods trade (exports + imports) surged from $0.47 trillion to $5.94 trillion, achieving an impressive annual growth rate (CAGR) of 11.6%.

1
8
17
📈 Leading Industrial Economies of 2023. Ranked by Manufacturing Value Added as a Percentage of GDP. #economy #ValueAdded #GDP #manufacturing #industry #industrial #production #Ireland #Taiwan #China #Thailand #SouthKorea #Vietnam #Malaysia #Slovakia #Czechia #Mexico

0
8
17
📈 U.S. $1.15 Trillion Trade Deficit vs. EU $40 Billion Trade Surplus and China $823 Billion Trade Surplus in 2023. · U.S. Trade Deficit: The U.S. trade deficit reached a historic $1.15 trillion in 2023, reflecting a long-standing trend of importing more goods than it exports.

1
9
17
📈 Money Supply in Advanced, EDMEs, and China (2000–2023).#GMSM #economy #liquidity #money #broadmoney #moneysupply #moneyprinting #inflation #market #asset #equity #gold #spx #bitcoin #crypto #stock #investing #investment #investor

5
5
12
📈 U.S. Broad Money Supply Stagnates While China Expands (2021–2024). From December 2021 to December 2024, the U.S. M2 money supply experienced near-zero growth, while China’s M2 expanded by 15.1%. Over the longer term, from 2000 to 2024, U.S. M2 grew at a compound annual growth

1
4
17
📈 U.S. Big Tech Stocks Surge (2000–July 2024). The market capitalization of seven major U.S. technology companies, known as the Seven Magnificent, surged by a factor of 13.5 (25% CAGR) from $1.1 trillion in 2012 to $15.4 trillion by the end of July 2024. This growth

0
5
16
📈 China's Export Reliance: A Return to Early 2000s Levels. China's exports-to-GDP ratio declined from a peak of 35% in 2006 to 17% in 2019–2020, before stabilizing at approximately 19% in 2021–2024. This level is slightly below the 20% observed in 2000–2001, marking a return to

1
5
17
📈 U.S. Big Tech Stocks Surge (2000–2024). The collective market capitalization of seven leading U.S. technology giants—commonly called the "Magnificent Seven"—has expanded dramatically, growing by 15.4 times (26% CAGR) from $1.1 trillion in 2012 to an impressive $17.6 trillion

0
6
17
📈 Global Natural Gas Production (2023). #USA #Russia #Iran #China #Canada #Qatar #Australia #Norway #energy #economy #ONGT #NatGas #NaturalGas #gas #LNG #shale #ShaleGas #petroleum #FossilFuels #fuels #OOTT #oil #SPX #GasIndustry #commodities #TTF

0
8
15
📈 World Trade Enters Era of Historical Low Long-Term Growth.Declining 10-Year Growth in World Merchandise Trade Since 2016. After decades marked by periods of rapid growth and sharp declines, world merchandise trade has entered a significant long-term slowdown, particularly

1
7
16
📊 Decrease in Oil and Gas Share of U.S. Energy Consumption (Excluding Coal) Since the 1970s.#USA #energy #energytransition #OOTT #oil #crudeoil #FossilFuels #fuels #NaturalGas #coal #RenewableEnergy #renewables

0
4
13
📈 Gold Prices vs. Silver Prices (1960–2024). Since 2016, the gold-to-silver price ratio has generally remained elevated. In August 2024, the ratio was three times higher than its average during the 1960s. #gold #silver #PreciousMetals #market #Bullion #GoldETF #GoldMarket

0
5
16
📈 The Rise and Evolution of Global Trade Openness (1960–2023). 1970s: Trade openness began increasing following the early 1970s collapse of the Bretton Woods system, which ended fixed exchange rates. The 1973-74 Oil Crisis led to surging commodity prices, further boosting trade

0
4
16
📈 Global Leaders in Food Exports. In 2023, global food exports exceeded $2 trillion, growing at a compound annual growth rate (CAGR) of 7.0% from 2000 to 2023, outpacing total goods exports, which grew at 5.8% CAGR. Notably, major food exporters like the U.S., China, and Germany

0
7
16
📈 Gold and Silver Price Correlation (2014–2024). Gold and silver prices generally display a correlation, meaning they tend to move in the same direction. However, this relationship is not perfect, and there are times when their prices diverge. In recent years, silver prices have

0
5
16
📈 Diverging Trade Dynamics: U.S. Deficit vs. China Surplus. In the 12 months ending November 2024, the U.S. trade deficit reached $1.17 trillion, while China recorded a $0.96 trillion trade surplus. Compared to the same period in 2023, the U.S. trade deficit rose by 9.7%, and

0
5
16
📈 Top Global Destinations for U.S. Exports in 2023. In 2023, U.S. exports totaled $2,020 billion. Exports to NAFTA partners—Canada ($353 billion) and Mexico ($323 billion)—accounted for 29.3% of total U.S. imports. The European Union was the next largest market, receiving $370

0
7
15
📈 European Union Exports to the U.S.: Key Product Categories. Pharmaceuticals, Machinery, and Automotive Comprise Half of EU Exports to the U.S. In the 12 months ending September 2024, European Union exports to the U.S. totaled €527 billion ($571 billion). Leading categories

0
6
15

📈 U.S. M2 Money Supply Growth Rebounds. After 16 Months of Contraction, Positive Growth Resumes Since April, with YOY Growth Reaching +3.1% in October 2024. #USA #FED #USDollar #economy #liquidity #money #BroadMoney #MoneySupply #inflation #market #asset #equity #gold #spx #spy

0
7
15

📈 Global Leaders in Pharmaceutical Exports. Global pharmaceutical exports surpassed $900 billion in 2023, growing 2.3 times faster than total goods trade between 2000 and 2023, with an impressive compound annual growth rate (CAGR) of 9.7%. The European Union, including intra-EU

2
10
15
📈 Normalizing the Pandemic Surge in U.S. Money Supply. United States Real Money Supply (M2) Returned to Pre-Pandemic Levels. #GMSM #USA #economy #liquidity #money #BroadMoney #MoneySupply #inflation #market #asset #equity #gold #spx #bitcoin #crypto #stock #investing

2
6
15
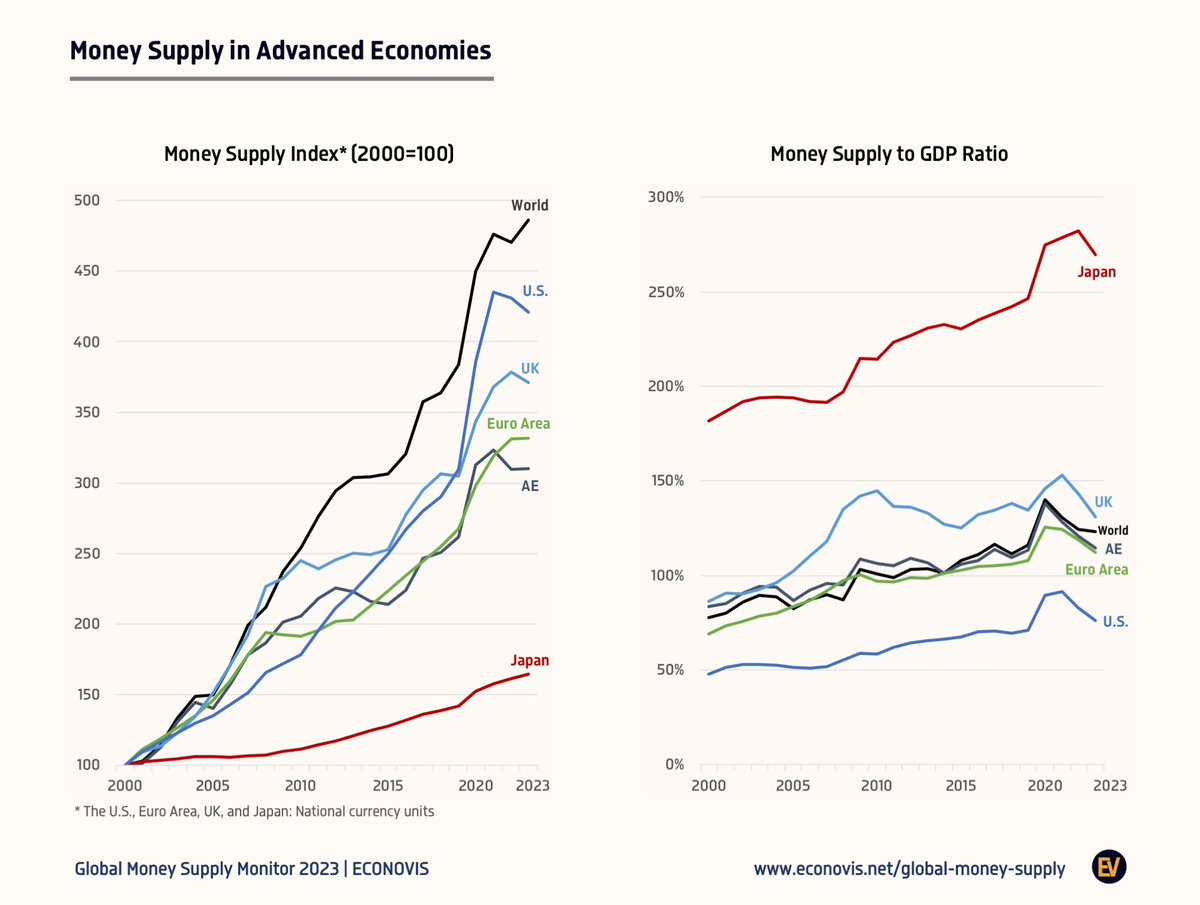
📈 Broad Money Supply in Advanced Economies (2000–2023). #GMSM #USA #EU #Euro #Japan #UK #economy #liquidity #money #broadmoney #moneysupply #inflation #market #asset #equity #gold #spx #bitcoin #crypto #stock #investing
1
4
10
📊 Shale and Conventional Oils: Share in U.S. Total Crude Oil Production.#USA #energy #energytransition #OOTT #oil #crudeoil #ShaleOil #FossilFuels #fuels

1
5
12

📈 Gold Prices Rise Despite Stabilizing Money Supply in the U.S., Eurozone, and UK. The increase in gold prices, despite stable money supply growth in the U.S., Eurozone, and UK, points to a decoupling from traditional monetary drivers. Factors influencing this trend include

2
5
15
📈 Russia Replaces Saudi Arabia as China’s Leading Crude Oil Supplier. In the first nine months of 2024, Russia accounted for 19.5% of China’s crude oil imports, compared to 14.4% from Saudi Arabia. #China #Russia #SaudiArabia #energy #FossilFuels #fuels #petroleum #oil #crude

1
8
15
📈 The Meteoric Rise of the Magnificent Seven. From 6% in 2012 to 28% in December 2024: Alphabet, Amazon, Apple, Microsoft, Meta, Nvidia, and Tesla Dominate U.S. Market Capitalization. #market #MarketCap #equity #stock #StockMarket #SP500 #SPX #SPY #Nasdaq #Nasdaq100 #tech

1
6
15
📈 Broad Money Supply Growth in Continents and Regions. #GMSM #America #Asia #Europe #Africa #Oceania #economy #liquidity #money #broadmoney #moneysupply #inflation #market #asset #equity #gold #spx #bitcoin #crypto #stock #investing

0
4
14
📈 S&P 500 vs. U.S. Money Supply M2 (1970–2024/05). #GMSM #USA #liquidity #money #broadmoney #moneysupply #market #asset #equity #stock #spx #SP500 #nasdaq #gold #bitcoin #crypto #finance #investing #investment #investor

0
3
13
📈 U.S. M2 Money Supply Reaches $21.63 Trillion in December 2024. The U.S. M2 money supply increased by 3.9% year-over-year and 0.87% month-over-month in December 2024, reflecting continued monetary expansion. However, at $21.63 trillion, it remains below its March 2022 peak of

0
3
15
📈 Federal Reserve Assets (2002–2024): 33 Months of Quantitative Tightening (Q1 2022 – Q4 2024). In response to the COVID-19 pandemic, the Federal Reserve's balance sheet expanded significantly, growing by 115%, from $4.16 trillion in February 2020 to $8.94 trillion in March

0
6
14

📈 Magnificent Seven" Market Cap Rebounds to $16.2 Trillion by October 18, 2024. The "Magnificent Seven" stocks—Apple, Microsoft, Nvidia, Alphabet, Amazon, Meta, and Tesla—experienced a 5.7% increase in market capitalization in the month ending October 18, 2024, following the

0
4
14
📈 Bitcoin Market Capitalization Hits $2 Trillion Milestone. Bitcoin’s extraordinary price rally pushed its market capitalization to a record-breaking $2 trillion in December 2024. This historic milestone represents a remarkable compound annual growth rate (CAGR) of 97% since the

1
5
14
📈 U.S. and Advanced Economies GDP Growth Gap Narrows by 2026. According to IMF projections, U.S. annual GDP growth is expected to decrease from 2.8% in 2024 to 2.7% in 2025 and 2.1% in 2026. In contrast, Advanced Economies are projected to see a modest rise in growth from 1.7%

1
5
14
📈 U.S. Becomes Leading EU Trade Partner, Surpassing China and Russia. The U.S. share of total EU trade rose from 14.7% in 2021 to 17.3% by August 2024 (TTM). In contrast, China’s share declined from 16.2% to 14.4%, and Russia’s share fell significantly from 5.9% to 1.4% over the

1
5
14
📈 Global Industry Sales of Semiconductors. The United States dominated the semiconductor industry until the 1980s, holding a 60% share of global sales in the early part of that decade. However, by the 2010s, its share had dropped to about 20%, while Asia's share surged from 10%

0
7
14
📈 EU Trade Surplus with the U.S. vs. Trade Deficit with China. From the third quarter 2022 to August 2024, European Union's goods trade surplus with the U.S. increased by 23% from €150 billion (TTM) to €184 billion (TTM), while goods trade deficit with China decreased by 29%

1
5
14
📈 Microsoft’s Revenue Hits Record $262 Billion, Net Income Soars to $93 Billion in 2024. Microsoft posted strong financial results in 2024, with revenue reaching $261.8 billion (up 12.9% year-over-year) and net income rising to $92.8 billion (up 14.5%), resulting in a net profit

1
3
14
📈 U.S. Semiconductor Stock Market Surge Compared to Real Economy Trends (2018–July 2024). #USA #markets #equity #stock #semiconductor #data #AI #tech #chips #DataProcessor #DataCenter #PHLX #SOX #SP500 #SPX #SPY #Nasdaq #Nasdaq100 #NVIDIA #Broadcom #Intel #finance #investing

0
6
13

📈 U.S. Global Trade Balance in 2023. In 2023, the U.S. goods trade deficit amounted to $1.153 trillion. The deficit with China reached $300 billion, representing 26% of the total. The trade deficits with NAFTA partners—Mexico ($157 billion) and Canada ($78 billion)—together

0
7
14
📈 U.S. Crude Oil Trade Balance (Nov 2024, LTM):.4.17 Mb/D Exports, 6.58 Mb/D Imports, 2.40 Mb/D Deficit. In the 12 months ending November 2024, U.S. crude oil exports averaged 4.17 million barrels per day (Mb/D), while imports reached 6.58 Mb/D, resulting in a trade deficit of

3
10
27
📈 BRICS GDP (PPP) Projected to Match Advanced Economies by Late 2020s. According to IMF data, the GDP of BRICS countries, measured by purchasing power parity (PPP), is expected to approach that of Advanced Economies by 2029. #economy #GDP #development #developed #developing

0
6
14
📈 Tech Titans Lead Q4 2024 U.S. Stock Market Surge. In Q4 2024, the U.S. stock market saw a remarkable $1.45 trillion surge in market capitalization, primarily driven by a handful of tech giants. The top contributors were Tesla, Amazon, Nvidia, Alphabet, Broadcom, and Apple,

0
6
14
📈 Global Life Expectancy Rate. #global #lifeexpextancy #life #longevity #lifespan #population #demographic #aging #fertility #totalfertilityrate #fertilityrate #infantmortalityrate #health

0
5
13

📈 Countries with the Largest Broad Money Supply in Local Currency Terms (2023). 1. Iran: 74,980 trillion Iranian Rial.2. Vietnam: 16,000 trillion Vietnamese Dong.3. Indonesia: 8,827 trillion Indonesian Rupiah.4. South Korea: 5,315 trillion Korean Won.5. Japan: 1,596 trillion Yen

1
6
14
📈 U.S. Semiconductor Production Surges While Total Manufacturing Stalls. In the first 11 months of 2024, the U.S. semiconductor production index rose by 7.1% compared to the same period in 2023, while the total manufacturing production index declined by 0.5%. Over the past

0
4
14
📈 U.S. Trade Deficit: Shift from China to the Rest of the World. The U.S.-China trade war has had a lasting impact on the U.S. trade deficit, redirecting a significant portion of it from China to other countries. From Q3 2018 to Q3 2024, the U.S. trade deficit with China as a

0
4
14
📈 Top 10 Stocks Drive S&P 500 Gains: 47% Surge vs. 13% for the Rest. In 2024, the combined market capitalization of the U.S. top 10 stocks—Alphabet, Amazon, Apple, Berkshire Hathaway, Broadcom, Eli Lilly, Meta, Microsoft, Nvidia, and Tesla—soared by 47%, significantly outpacing

0
5
14
📈 TSMC Hits the Trillion-Dollar Milestone. On October 17, 2024, TSMC’s market capitalization soared to $1.07 trillion after the company announced strong Q3 2024 financial results. Since 2010, TSMC’s market cap has grown at an annual growth rate (CAGR) of 24%, with net revenue

0
4
14
📈 U.S. Data Center Construction Spending Soars Amid AI Investment Surge. Driven by the rapid expansion of artificial intelligence projects, U.S. data center construction spending surged by 139% from the 2022 average to October 2024, reaching a seasonally adjusted annual rate of

0
5
14
📈 U.S. Stock Market Capitalization to M2 Money Supply Ratio Hits Third Highest Peak in Q2 2024. #USA #economy #moneysupply #broadmoney #liquidity #markets #marketcapitlization #GDP #asset #equity #equities #SP500 #SPX #SPY #stock #stockmarket #finance #investing #investment

0
3
13
📈 U.S. and EU Drive 61% of China’s Trade Surplus in 2024 Despite Modest 24% Trade Share. In 2024, China's trade surplus was heavily driven by the U.S. and EU, which accounted for 61.3% of the total surplus. Despite their significant impact, these regions represented only 23.9%

0
5
13
📈 Global Life Expectancy Rate in Relation to the U.S. Countries with Higher and Lower Life Expectancy Rate Compared to the U.S. in 2022. Life expectancy in the United States lags behind not only advanced economies but also several developing countries. Nations like Chile, China,

0
8
13
📈 Eight Stocks Drive Over 50% of S&P 500 Gain in the First Three Quarters of 2024. Share of S&P 500 Market Capitalization Gain in the First Three Quarters of 2024:. 1. Nvidia: 20.1%.2. Apple: 6.3%.3. Meta: 6.2%.4. Microsoft: 4.6%.5. Amazon: 4.3%.6. Alphabet (Google): 3.4%.7. Eli

0
6
12
📈 S&P 500 vs. U.S. M2 Money Supply: Convergence and Divergence (1970–2024). Since the mid-2010s, the S&P 500 index and the U.S. M2 money supply generally moved in tandem, reflecting a strong relationship between monetary expansion and stock market growth. However, after 2023,

1
3
13
📈 Top Ten Stocks Power 64% of S&P 500's Gains in 2024. Breakdown of Contributions to S&P 500 Market Capitalization Growth in 2024:. 1. Nvidia: 20.4%.2. Apple: 7.8%.3. Amazon: 7.3%.4. Alphabet (Google): 5.7%.5. Meta Platforms (Facebook): 5.6%.6. Broadcom: 5.5%.7. Tesla: 5.0%.8.

0
4
13
📈 Evolution of the Global Steel Industry (1967–2023): China as the Driving Force. From 2000 to 2023, crude steel production in Canada, Europe, Japan, and the U.S. collectively declined by 19%, while global production increased by 140%. China experienced a remarkable 722% surge,

0
3
12
📈 Global Trade Policy Uncertainty Index: Volatility from 1960 to 2024. The index highlights significant periods of heightened trade policy uncertainty, with the latest surge occurring after the U.S. election. This rise stems from renewed threats of higher U.S. tariffs on

0
5
13
📈 China's Global Trade Surplus Soars, but U.S. Growth Lags. Since the onset of U.S.-China trade tensions in 2018, China's overall trade surplus surged by 176%, climbing from $359 billion to $992 billion by 2024. However, the growth in China's trade surplus with the U.S. was

0
5
13

📈 Gold Prices vs. U.S. M2 Money Supply (1970–2024). #gold #goldprice #economy #market #USA #money #broadmoney #moneysupply #liquidity #XAUUSD #risk #investing #investment #investor #asset #gold #stock #silver #bitcoin #crypto

2
3
13


📈 Global Gold Market Capitalization to GDP Ratio (1990–2024). Market value of above ground world gold stocks to world GDP ratio reached 16.7% in 2024, four times more than 2000. #gold #Bullion #GoldETF #GoldMarket #PreciousMetals #GoldPrices #GoldMining #GoldInvestment #spx

0
6
13

📈 Global Trade Dynamics by Continent (1970–2023). In the 1960s and 1970s, Europe accounted for 50% of global trade, followed by the Americas at 23% and Asia at 17%. Asia's share of global trade steadily increased, surpassing Europe in 2010. Between 2000 and 2023, Asia's trade

0
5
13
📈 China’s $1.8 Trillion Manufactured Goods Surplus vs. India’s $57 Billion Deficit: Diverging Trade Paths in the 21st Century. China's manufactured goods trade surplus skyrocketed from $56 billion in 2002 to $1.8 trillion in 2023, growing at an impressive annual rate of 43%

1
4
12
📈 European Union Exports to the U.S. Hit $571 Billion (€527 Billion) in September 2024 (TTM). In the 12 months ending September 2024, European Union exports to the U.S. reached $571 billion (€527 billion). From 2000 to September 2024, these exports grew at a compound annual

0
3
13
📈 China's Export Reliance on the U.S. Falls Sharply, Mirroring U.S. Import Shift Away from China. The U.S. share of China’s exports rose from 14% in 1985 to a peak of 42% in 1999 but has steadily declined since 2000. By 2016–2018, it had dropped to 22%, and following the

1
8
13
📈 China's Trade Dependence on the U.S. Declines Sharply, Outpacing the U.S. Shift Away from China. The U.S. share of China’s trade (exports + imports) increased from 11% in 1985 to a peak of 26% in 1998 and 1999. Since 2000, this share has gradually declined, reaching 10% in

0
6
13

📈 Gold Prices vs. U.S. M2 Money Supply (1970–2024). Since the mid-2010s, gold prices have generally moved in tandem with the U.S. M2 money supply, indicating a close relationship between monetary expansion and gold's role as a store of value. However, after 2023, gold prices

1
5
13
📈 Global Gold Market Capitalization Reaches $18.4 Trillion in 2024. By December 2024, the global gold market capitalization surged to an estimated $18.4 trillion, equivalent to approximately 16.7% of global GDP. This reflects the rising value of gold amidst strong production

0
7
13
📈 Top 10 U.S. Stocks Achieve $20.4 Trillion Market Cap in 2024. The combined market capitalization of the top 10 U.S. stocks—Apple, Microsoft, Nvidia, Alphabet, Amazon, Meta, Tesla, Berkshire Hathaway, Eli Lilly, and Broadcom—soared to $20.4 trillion as of December 31, 2024.

1
5
13
📈 Market Capitalization Growth of the Four Largest U.S. Banks (2000–2024). The combined market capitalization of J.P. Morgan, Bank of America, Citigroup, and Wells Fargo increased by 33% in 2024, rising from $1.04 trillion in December 2023 to $1.38 trillion by year-end. J.P.

1
4
13
📈 Diverging Trade Balances: U.S. Deficit Hits $1.2 Trillion as China’s Surplus Climbs to $1.0 Trillion. In 2024, the U.S. trade deficit widened to $1.2 trillion, marking a 13.3% increase from the previous year, while China’s trade surplus expanded to $1.0 trillion, up 20.7%

0
5
13
📈 China's Share of World Trade Reaches 12.3% in 2023 vs. EU at 11.4% and U.S. at 10.8%. China's share of global goods trade rose to 12.3% in 2023, surpassing the European Union at 11.4% and the United States at 10.8%. From 2000 to 2015, China's share surged from 3.6% to 11.9%,

1
7
13
📈 China's Crude Oil Imports Reach 11.1 Mb/D in 2024, Down 1.9% from 2023. China's crude oil imports averaged 11.1 million barrels per day (Mb/D) in 2024, reflecting a modest 1.9% decline from 11.3 Mb/D in 2023. Following robust growth of 11.2% annually (CAGR) between 2002 and

0
7
13