
Adi Wyner
@adiwyner
Followers
1,949
Following
275
Media
98
Statuses
881
Professor of Statistics and Data Science. Co-Faculty director of Wharton Sports Analytics and Business Initiative.
Philadelphia, PA
Joined July 2011
Don't wanna be here?
Send us removal request.
Explore trending content on Musk Viewer
#FayeBDPartyInNanning
• 99748 Tweets
Release Now
• 49533 Tweets
メジャー
• 35920 Tweets
鶴丸国永
• 25468 Tweets
#キントレ
• 22388 Tweets
#HaryanaElections
• 17585 Tweets
TANATAT STAGE BIRTHDAY
• 17570 Tweets
CWR x CeraVe Cleanser
• 17203 Tweets
オースティン
• 13486 Tweets
TREASURE AT MANDIRI KARNAVAL
• 12913 Tweets
UNLV
• 11942 Tweets
Syracuse
• 11458 Tweets
花火大会
• 10907 Tweets
BINI WITH PENSHOPPE
• 10710 Tweets
#私の生活に欠かせないもの
• 10223 Tweets


I cannot be prouder of Sam Mondry-Cohen A.G.M. of the World Champion Washington Nationals. Sam was my first undergraduate student of Sports (Baseball) Analytics at Penn (10 years ago)
@WMoneyball
@Penn

2
9
134
This is true even if you assume the relationship between clots and the vax is causal. We have warned repeatedly on
@WMoneyball
that with a large vaccination campaign there will be coincidental events that will be perceived as complications.

6 cases out of 7 million people. What a disaster. This is going to get people killed. And it's going to create more vaccine hesitancy. These people don't understand cost-benefit analysis. They keep making mistakes by orders of magnitude.
2K
6K
28K
3
23
132
Is the "third time through" effect real? Starting pitchers are not worse third time through the order (green), they only look worse compared to time 2 (red), because they usually don't face the weak hitters in the bottom of the order. Data is 2019.

19
17
100
Just learned that Bibi read my article. That’s nothing compared to the time Derek Jeter responded to my article (which showed he had very little range up the middle) .

From
@tabletmag
:
“How the Gaza Ministry of Health Fakes Casualty Numbers”
“The number of civilian casualties in Gaza has been at the center of international attention since the October 7 massacre. The main source for the data has been the Hamas-controlled Gaza Health Ministry.
447
409
984
33
14
90

According to baseball reference a 2019 team of Cody Bellinger and 8 replacement players could expect the same number of wins as 7 Bryce Harpers and 2 replacement players.
5
5
36
I was curious to see how chat GPT would do on a very simple 1Y Wharton MBA level stats quiz. The students had 10 minutes to solve 5 questions. Chat GPT got 4 out of 5. It made one small error (about 20% of the students made the same error). 1/n
1
4
33
A dataviz crime. Check out the different scales on the y-axis: the Biden graph is a close up to make deviations more pronounced. Other things are wrong too in this Benford's law deviation graph.
2
4
33
The data in my article in
@tabletmag
on the casualty count is reported "as of" the given day not that it was "released" on that day. So the low variation in total daily count is not likely caused by "work flow bottleneck" .
1
4
28
In Israel this is true: most of the seriously ill are vaccinated. Also true: the rate of serious illness is 10 times higher among the unvaccinated. Base rates.


2
6
30
I divided the US into 4 regions and tracked new cases per 10K population across each. The West and South look the same, the Midwest is a shifted and shorter version of the Northeast (which looks just like Europe).

3
7
27
Another great Moneyball Academy finishes up. This group was a particularly notable and talented portion of the class. Many thanks to
@Stat_Ron
@skdeshpande91
and our many dazzling guests

0
3
27
Randomness dominates runs even with the best of forecasts using the best data.
@StatsbyLopez
@WMoneyball
@JackSoslow
@WhartonSABI

Even with tracking data randomness completely dominates runs. The mean yards is 4.27 and the SD=6.49 (1-12 games of 2019.) The Zoo's forecast has RMSE= 5.95. That's a lot of work for a 1/2 a yard of prediction accuracy.
0
4
22
3
8
26
@tabletmag
Also, the numbers don't go up during the cease fire, which they would if there were a bottleneck delay.
0
3
22
Proud of our very own
@WhartonSABI
students and Wharton Moneyball Academy
@wmoneyball
staff
@ZachDrapkin
&
@sarahhuuuu
for putting their
#SportsAnalytics
expertise to good use while interning for their favorite
@NFL
teams.
1
1
25
@NAChristakis
Horribly bad take. It hasn’t “already” . It “will” if virus stays at epidemic levels forever. You need to clarify . You have to big an audience to let this stay.
2
0
18
Our student's
#BigDataBowl
submission shows that deviations from optimal path is negatively correlated with average return. Could a kick returner's value be determined more by path selection (brains) than speed and power (brawn)?


For the NFL
#BigDataBowl
we (
@RyanBrill_
@taidn97
@ryanzgross
) train a model of kick return value based on tracking data, then use that model to predict the value of candidate movements for a returner
This leads to an optimal "next step" (green) at each moment!
@StatsbyLopez
1/2
4
5
54
0
5
24
This is an incredible way for high school students to learn more about data science and sports analytics.

Registration for our High School Data Science Competition with
@whartonyouth
is live!
Teams of 3-5 high school students will learn new
#datascience
skills and compete to make the best predictions about our fictional soccer league’s playoffs.
Learn more:
1
3
8
1
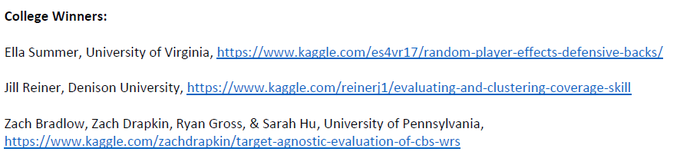
7
22
Incredible news. Huge congratulations to my students Zach B., Zach D, Sarah and Ryan. We are so proud of your accomplishments... and all were Wharton Moneyball Academy students or staff!
@WMoneyball
@WhartonSABI
@ebradlow
@pennsrg
0
4
23
Even with tracking data randomness completely dominates runs. The mean yards is 4.27 and the SD=6.49 (1-12 games of 2019.) The Zoo's forecast has RMSE= 5.95. That's a lot of work for a 1/2 a yard of prediction accuracy.
0
4
22
I was looking for just the right graph to most prominently demonstrate what happens after a country vaccinates.

0
1
22
If a kicker's "deviation" is Normally distributed and centered at the midpoint of the uprights, then a field goal attempt from a distance that has an 85% success rate will bounce off a goal post approx. 2.8% of the time (1 in 35.7).
@StatsbyLopez
@WMoneyball
.
1
3
22
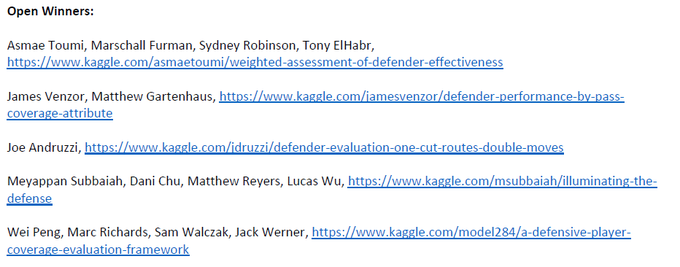
Terrific submission by our students to
#BigDataBowl
.They use machine learning to score every receiver/defender play independently of QB targeting decision and then track and evaluate players on an ELO scale.
@Wharton
@WhartonSABI
2
7
21
No model should be relied upon to extrapolate a time series more than a few points past the end of the domain. That’s the proper lesson here.

Got some exciting news for Chiefs fans. Taking notes from the White House, I used a cubic model to estimate how Mahomes' future games will go.
The model fits the data very well, so I think we can be confident in it's future estimates!!

21
57
547
2
3
19
Since 2011, the number of nationally ranked, i.e "starred", football recruits has exploded in the Ivy league (esp. Yale, Harvard, Princeton) . Yale is killing it (go Bulldogs). Who knew?
@bcmassey
@WMoneyball


4
3
20
5 star recruits are very likely to be drafted; but there are very few of them. Here is a breakdown by star rating.
@kenshropshire
@WMoneyball


1
7
19
Good and bad news from latest Israeli data.
The bad: boosters don't do much to prevent infection.
The good: compared to the unvaccinated the boosted are 100 times less likely to develop a serious case.
This is huge.
1
4
19
If you correlate two independent completely random walks there is about a 10% chance that |r| will be greater than .85. Moral: don't correlate time series,
@NateSilver538
(Yule's Nonsense Correlation)
0
2
19
Once again, I am super proud of our
@Penn
@Wharton
and
@WMoneyball
team: undergrad stars
@ZachDrapkin
@zachbradlow
@sarahhuuuu
newcomer grad students
@RyanBrill_
@JRudoler
and veteran
@ryanzgross
. Amazing.

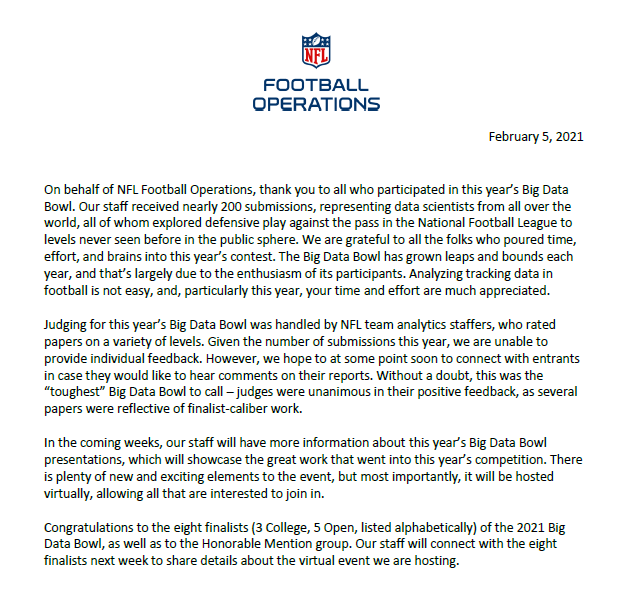
What an impressive set of
#BigDataBowl
entries on Special Teams.
Congratulations to the 2022 finalists!

3
35
194
0
2
18
Congratulations to Mike Mussina whom I watched pitch at the Sunken Diamond when we were both students at Stanford (admittedly I sat on the grass and solved math problems)- but they were great afternoons. Oh, and regression works well.

0
3
18
My research with
@RyanBrill_
shows that only 30% of all fourth down decision are *extremely* obvious (surprising?). Coach rankings on just these plays:

1
4
18
Two forecasts for deaths in the coming week. MIT (orange) says deaths will go down. MSFT(green) says no. Neither recognize the possibility the other may be right (check out the 95% prediction intervals). The failure to understand this is the story.

3
1
17
I am increasingly convinced there is something not right about the data. Can cases steadily tend up with death decreasing over a two month period? This is CA.

10
3
16
I talked about these data on Wharton Moneyball
@WMoneyball
, but it took a couple of weeks to get published.

2
4
15

Another
@StatsbyLopez
: In Israel 68% of those currently hospitalized for COVID are vaccinated which equals the 68% of the country that are vaccinated. Bad news? No- at every age the vaccinated are about 10X less likely to be hospitalized.
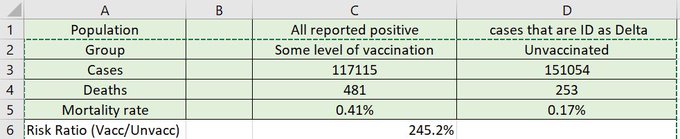
Great example of Simpson’s Paradox in the wild.
Among all UK residents, mortality rate is 2.4x higher among vaccinated.
But when broken into age groups, mortality rate is either 1.5x higher (<50 years old) or 3.5x higher (> 50 years old) among unvaccinated
H/t Matt Brenneman
7
76
319
0
2
14
@BillAckman
I relied on OCHA data. Today I learned that OCHA is currently sourcing its women casualty count to the UN Women Report, which sources its count to.... OCHA. Insane. ( from
@elderofziyon
with links)
5
0
13
This is incredible. Someone had to work hard to make the Y-axis of this graph so irregular, but why? I think I will use it next year in my
@Wharton
MBA class.

You can teach an entire semester of how to lie with statistics with the y-axis of this chart.

718
12K
56K
1
2
14
The skeptic/cynic in me expected the NYTimes to skew the distribution of ages among sample of 1000 COVID19 victims in today's paper. So I was surprised when they didn't (ok, maybe a little).

1
1
13
Proud of my students Jack, Andrew and Jake on making it to the finals of the
#BigDataBowl
.

Super excited for our team to present at the NFL combine for the
#BigDataBowl
! Amazing opportunity to show off some great analytics work plus our “bombshell” finding that we didn’t have enough time to include in our submission.
@jakef1873
@AndrewCastle510
@adiwyner
and Eric Dong


0
1
35
0
2
14
No excess deaths in 2020 for under 25. the x-axis is week of year and y-axis (cumulative) percentage excess deaths controlling for week, state and age. Data is from the CDC. It looks like art; it's not but it could have a calming effect on my students.

1
2
13
The virus spreads mostly within families. prediction: Countries that have large numbers of elderly who also live with children and grandchildren will fare the worst- by far. I I think this partly explains the terrible outcomes in Italy/China.
2
0
13
MLB analysts spent a lot of time estimating the most effective mix of pitches. Did the Yankee staff learn the hard way that correlation is not causation?

1
3
13
A cubic fit of confirmed US virus cases versus time. Model forecasts 57,000 cases by March 17th. The confidence curve is total bullshit (way too narrow, since the residuals are obviously correlated) but the estimate is reasonably unbiased.

2
2
12
The results of a productive summer of undergraduate research at UPenn.

playerElo has now been published on FanGraphs! I developed this statistic with Professor Wyner (University of Pennsylvania) to accurately evaluate MLB players by quality of competition and context dependent run values of batted ball outcomes.
7
15
65
0
1
12

Cases in Arizona are spiking. In other states, deaths spike about 10 days after cases rates spike (NJ is graphed). That has yet to happen in AZ. Is the death spike late or will it never come? We should all be watching carefully.

1
2
12
Wonderful visit today to Wharton Moneyball Academy. Thank you Dr. Evans!
@CausalKathy
Catch and shoot, pull up jumper and all of the stats to go with the different types of shots. Thanks
@CausalKathy
for your enthusiast talk and love for what you do (and the Warriors)!

0
0
8
0
1
12
Barkley: " teams didn't start flying private until the Detroit Pistons won the championship in like '88, '89 and they started this phase of flying private and then everybody started chartering." Below is ELO adjusted HFA (tip
@uzmons
). Coincidence? Is HFA sleep driven?

1
3
10
The place to go is
@WMoneyball
podcast or Sirius XM radio 111. 4 UPenn statisticians taking Covid for 30 minutes. Come for Covid stay for the sports analytics
@jessesingal
2
1
11
@WMoneyball
This is why “win probability added “ is not a great stat. A walk off homer in the bottom of the ninth is nearly .5 w.p.a. While the same homer in the bottom of the first-that makes the bottom of the ninth unplayed- is worth much much less.
2
1
11
Run expectancy is 1.0 with runner on third one out, not 1.2 as reported in this article. The home team if tied may wish to bunt if success prob is greater than 80%.
1
2
10
I conjecture that + test % can be used to estimate true count, since (log) death rate is surprisingly correlated with (log) + rate (assuming true IFR is roughly constant.) Thus NYC (+ rate = 40%) has about 1 million infections.

0
0
11
It was an incredible year! So much talent in this group.

🌞2023 High School Programs Complete! This summer, high school students from around the world participated in
@WhartonSABI
high school programs, virtually & in-person on the
@Penn
campus.
Thanks to our incredible instructors & fellow classmates for an great experience! 📚


0
4
16
1
0
11
The calculated "life expectancy" decreases assume that covid-era hazard rates never go back down. The NYTimes article doesn't tell you this. I estimate that the average number of years lost to covid (so far) is about 5 days not 2.7 years.

0
2
10
Best (and first) "hot dog analytics" I have ever seen. Perhaps we will discuss next Wednesday with
@ebradlow
on
@WMoneyball
.

In today's
@originalnathans
Hot-Dog Eating Contest,
@joeyjaws
increased his consumption rate for the 3rd year in a row. 8.11 seconds/dog make him almost fast enough for D'Antoni's "7 Second's or Less" offense. Peak Kobayashi can't touch Chestnut.
#NathansHotDogEatingContest


4
3
6
1
5
11
The reason the CDC halted the J&J vaccine? "out of an abundance of caution." This is illogical- the consequence of the misunderstanding and misuse of the null hypothesis significance test.
1
0
11
4 suggestions for making inferences 1. Beware of extrapolations 2. Don’t only do a univariate analysis 3. If it is not obvious which multivariate analysis you should do one anyway 4. Pay attention to simple rules.

A lot of talk about Kyler Murray and his height today.
Among QBs that have started at least 16 games since 1987, there is essentially zero correlation between QB height and... *BREATH*....
35
146
383
2
1
9
Glad you liked this. When
@RyanBrill_
and I began this work, about a year ago, this was the issue that bothered me the most. Second, was failing to recognize that uncertainty is massive when using machine learning on highly auto correlated data
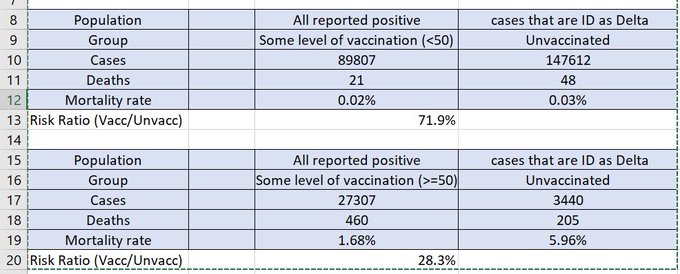
This is an outstanding point by
@RyanBrill_
NFL expected points models are all subject to selection bias. Better offenses make the red zone more often, so inferences on red zone tendencies overfit to better teams
8
22
291
0
0
10
@StatsbyLopez
At the risk of resurrecting an old conversation, I will again point out (because it is still true) that demonstrating that a forecast is calibrated doesn't mean it is usefully accurate.
2
0
10
Oops. The authors forgot that Penn is the only Ivy that shares a name with a state school requiring its students to explain.


0
0
10
Weeks 1 and 2 are so interesting because they happen first- not because they are predictive. Even weeks 15 and 16- when so many teams are out of contention- are more predictive of win total. Surprised
@ebradlow
?

The latest from
@adiwyner
&
@ZachDrapkin
: Addressing which two consecutive games during the NFL season are most predictive of regular season win total.
Answer is surprising!
Weeks 1-2 are LEAST predictive. The most predictive is weeks 10-11.
🔊
@BizRadio132
🔊

3
18
45
0
2
10
Compare *estimated* new positive cases (green) in Philly to positive (red) and negative (blue) test. If I am right, then the actual course of the virus is a super rapid period of growth followed by a very rapid drop. The actual positive test trend hides this.

1
2
10
@kcjohnson9
@UMich
Writing letters of recommendation for students is a small but crucial part of a professor's job. I have written hundreds, even for students who will attend programs whose politics I detest. This professor is refusing to do his job. The university response is pitiful.
1
7
9
Our Wharton undergrad team… Sarah and the Zachs…. have a great submission also demonstrating the importance of brains! Super results.
@sarahhuuuu
@ZachDrapkin
@zachbradlow
0
0
9
@friscojosh
@oliversveryown
@JustinMacMahan
You might like this graph of points (quality) vs. price. Nice logarithmic relationship. I used it on an exam.

0
1
9
Discussed this week on
@WMoneyball
: published study (Blinded RCT) of high dose Vitamin D for hospitalized C19 patients. Unbelievably large effect size; so large, that people are suspicious.
1
1
7
We were delighted to welcome to campus the aspiring young analysts from
@NBAMathHoops
to learn math, stats and basketball with PhD student
@XanderDoesPhil
and undergrads
@ZekeKelz
and
@JustinLipitz
who are all staffing
@WMoneyball
Academy in a few short weeks.
And a huge THANK YOU to
@ZekeKelz
,
@JustinLipitz
, &
@XanderDoesPhil
for teaching and leading the tour today!
0
2
11
0
1
7
@FiveThirtyEight
@Stat_Ron
doesn't this violate some data_viz rule? Color should reveal a different dimension (like density) not distance which is represented already.
1
0
8
@AnnieDuke
Coin tosses are chance processes; the “probability” in a poll is uncertainty not chance.
3
2
8
@JoshMalina
Don't know, Josh. Hamas fakes the number of killed fighters. This creates the false impression that Israel is targeting civilians and that the civilian deaths are disproportionate to the military advantage gained. Does that help?
1
0
7
Ryan's talk at Harvard on our football research. Paper will follow soon (don't bother
@RyanBrill_
I'm the rate limiting factor).

NESSIS talk “Analytics, have some humility: a statistical view of 4th down decision making” is now on YouTube, . Working on the paper…
7
22
86
0
0
7
@tangotiger
@toner564
@bburkeESPN
Best advice for aspiring Saberists and other sports analysts: "Do the job before you have it" -Sam Mondry Cohen (Washington Nationals, AGM).
@WhartonSABI
0
0
8
I have to confess that shortly after my booster shot I had an irresistible urge to root for the Mets. It went away.

I guess it's time to come clean about the scary side effects of the COVID vaccine. Soon after my second shot, I noticed mysterious bumps on my forehead and an alarming surge in combativeness and bloodlust. Now I look like this. 😟 Think it will go away?

45
14
288
0
0
7
Just discovered this autograph among my father’s books. It’s the Math equivalent of a Mickey Mantle card.

0
1
7
Analytics for E-sports? Coming soon.
In Shanghai, Professor
@adiwyner
discusses "Building an Education Oriented Esports Ecosysterm" at the Tencent Esports Conference.

0
2
4
0
3
7
Details: (
@CFBWinningEdge
@SamCaruth1
@WMoneyball
) I ran a MLR to predict (modified) point differential using team-season "power scores" and HFA (3 level) term. The standard error on the HFA (each season) is about 1/2 point.

@SamCaruth1
Haven’t heard the discussion yet (can’t listen live & must wait for the pod) so can’t be sure. But would assume each dot is the average homefield advantage ATS for all teams across the nation on a yearly basis (& as big a sample as we could hope for).
Don’t know yet though.
0
0
0
1
3
6
RelRate (death) by age, week, year for NJ, PA (where I live) and ND (where spread is worst) . Rates are scaled to 2015-2019 mean. NJ was a scary place in the spring. Lot's of interesting data...

1
1
7
Super guests tomorrow. Tune in live or listen to the podcast.
Great show tomorrow morning at 8AM ET!
Guests:
8:30AM:
@DavidEpstein
- NYT Best Selling Author - New book “RANGE” out today
9AM:
@JeopardyJames
- Current 28-straight game Jeopardy Champion and professional Sports Better
Tune in as always on
#SiriusXM132
@BizRadio132
!
0
1
6
0
1
7
While readying for
@WMoneyball
special, I predicted yards with gradient boost with just down, dist, yrdline, dfdrs in box, RB yards from scrimmage and RB velo: test set RMSE = 6.12 yards. Is this "practically" worse than the Zoo's forecast?
@StatsbyLopez
@Stat_Ron
Randomness dominates runs even with the best of forecasts using the best data.
@StatsbyLopez
@WMoneyball
@JackSoslow
@WhartonSABI
3
8
26
0
3
7
Many thanks to
@RyanBrill_
for putting the work into this. It should be a super resource for those interested in baseball research.
0
0
7
Pay attention to
@mixedknuts
Academics are not incentivized to do this well, especially when the "finding" may be a result of data quality issue.
0
3
7
I came up with this idea many years ago and many undergrad students worked on it with me to help push the idea along (including inventing the name) but Ryan was really able to tie the loose ends and at the math.
🚨🚨🚨Consider 2 pitchers: pitcher A allows 6 runs per complete game, and pitcher B alternates allowing 0 runs and 12 runs per game. All else equal, which pitcher would you rather start? In our new paper,
@adiwyner
and I address this question. 1/n
11
23
127
0
2
7
I am increasingly concerned, if not yet convinced, there is a false positive problem emerging. I just learned of an actual example from a friend in NY: a man had COVID19 but tested positive months later.
3
1
7
Nothing but admiration for someone willing to stick their neck out and make a concrete point prediction way in advance as
@mathbabedotorg
has done: 600 (seven day average) deaths by August 4th in Florida.

1
0
5
Jews who play sports at the highest level? Not too many. But Jews that THINK about sports? Many of us there. Check out the episode. So much fun to speak with
@meredithshiner
.
1
1
7
@friscojosh
@MichaelSalfino
No state with increases in cases has increase in deaths. CA has seen cases rise linearly for 3 months and no increase in deaths. AZ and TX and FL are "due". It's like the HR increase in baseball: lots of possibilites, no single reason and lots of unknowns.

3
1
6
This is a conjecture. Here is another. The PCR test is extremely sensitive. The viral load for Delta is very large. Jointly, this means that many people who are vaccinated and test positive may not be infected at all and are not spreaders.
0
0
6
@NAChristakis
@jordan_peccia
@SaadOmer3
@NathanGrubaugh
@WeinbergerDan
In this paper, two time series are first smoothed and scaled and then correlated. A statistical crime.
1
0
6
@StatsbyLopez
@WMoneyball
The tip information is not worked into the calculation. Here is the graph of the approx. "doink" probabilities as a function of the distance. It's a fun way to teach the Normal model. Note the inflection point at about 50 yards.

2
5
5
@Stat_Ron
@nflscrapR
Random Forest "probabilities" aren't in fact probabilities not withstanding the fact that they often function reasonably well in that role:

1
2
6
This was the only wrong answer. And it was barely wrong at that. Except for the small error (the winning payoff is 800 not 900) the solution is exceptional.

2
0
5