
Hodhodata@statistics
@Statisticizer
Followers
1,997
Following
406
Media
429
Statuses
1,918
Statistical Data Analyst , Statistical programmer, Applied statistician & Bio-statistician.
Irbid city Of Jordan
Joined October 2017
Don't wanna be here?
Send us removal request.
Explore trending content on Musk Viewer
#BUS_KnockKnockKnock_KhonKaen
• 1249980 Tweets
スプリンターズS
• 85794 Tweets
CRかるび
• 47226 Tweets
WIN AT TODAY SHOW
• 42225 Tweets
スプリンターズステークス
• 34627 Tweets
ナムラクレア
• 25463 Tweets
三原じゅん子
• 22283 Tweets
REBECCA SUPPORTING ACTRESS
• 20328 Tweets
西村騎手
• 19965 Tweets
サトノレーヴ
• 19405 Tweets
ママコチャ
• 19019 Tweets
西村淳也
• 17339 Tweets
YINWAR x VIF x TOPS
• 15792 Tweets
#njdest
• 15768 Tweets
#相葉マナブ
• 15252 Tweets
ドゥラメンテ
• 14865 Tweets
マッドクール
• 14192 Tweets
ピューロマジック
• 10503 Tweets


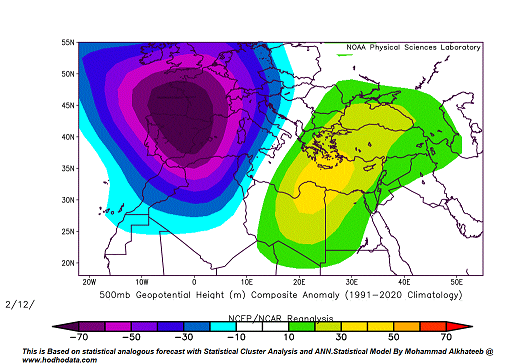
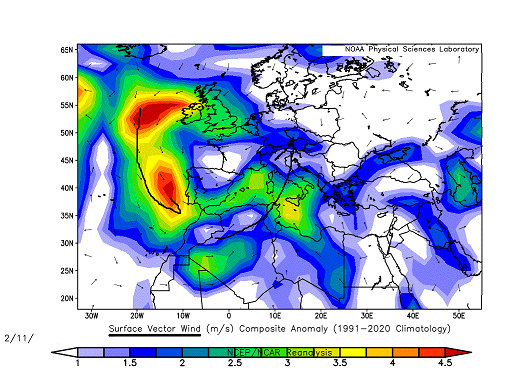
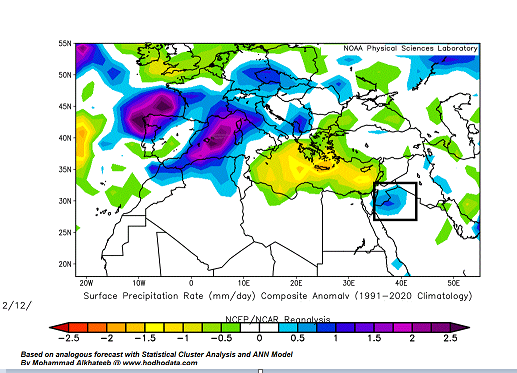
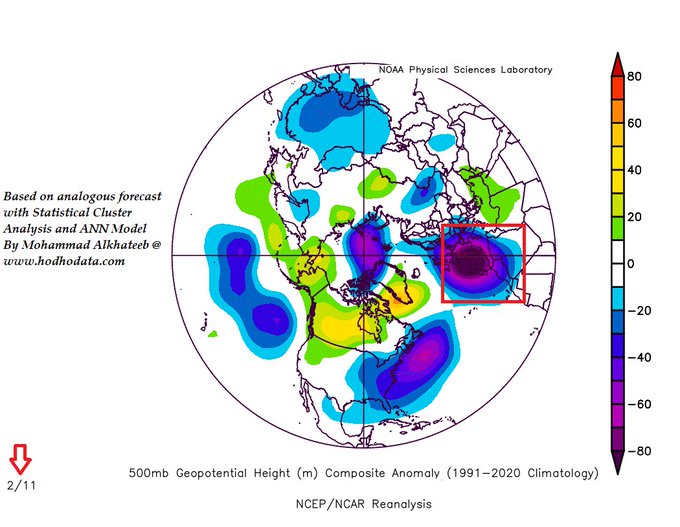
Also waiting a confirmation from the Numerical Weather Prediction Models for this statistical-based analog forecast for the period between 10_14 February. Stormy conditions and immense rainfall events could possibly be observed in Iberian sea,N. Spain and Portugal & N. Africa .

14
23
90
1/3 comments: Southern Western Europe and North Africa for the period between 15_22 April.The regions highlighted with bluish to purplish colors are possible for Immense rainfall events.This rainfall pattern is uncovered statistically and congruent with MJO Phases 3_6 for April


11
20
81
#SPAIN
: An early sign for descent rainfall/ convection Southern Spain and North Morocco near the second decade of March . This analysis is interim and statistical analog based and may characterize propensities of rainfall not necessarily density of rainfall between 7-13 March .


4
14
76
مرفق تحليل احتمالات عنف الطقس لشهري فيبراير و مارس مجتمعة : المناطق الموشحة بلون ازرق او فوشي قد تكون عرضة للهطولات الغزيرة جدا عبر حالات عدم الاستقرار التي قد تسجل عبر الشهرين. سواحل عمان و اليمن و مناطق من الامارات و وسط الجزيرة العربية معنية بهذه الهطولات و بعضها قد يكون خطر.

5
18
69
ارجحيات السيول بشهر نوفمبر : المناطق الموشحة بلون ارجواني تميل لتسجيل حالات عدم استقرار محلية بعضها غزير و قد تتسبب بارتفاع منسوب المياه و جريانها ضمن اول 17 يوم من نوفمبر و الارجح اول 13 يوم , و الله اعلم .. هذه مخرجات بنيت احصائيا و ليست حتمية .صور اضافية بالتعليقات.


5
15
69
لشهر مارس بالتحديد: المناطق الموشحة بلون فوشي او ازرق عرضة لحالات طقس قد تكون شديدة في حالات عدم الاستقرار او المنخفضات التي قد نشهدها في شهر #مارس القادم و تشمل مناطق كل من جنوب و شرق عمان, شرق المملكة العربية السعودية و مناطق قطر و الامارات العربية المتحدة . و الله اعلى و اعلم.

13
17
62
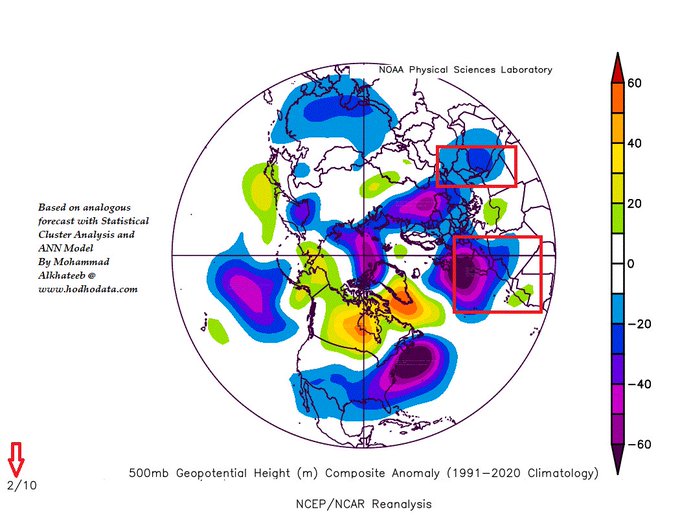
November-December Possible 500 hpa geopotential anomalies configuration as yielded from a statistical analog model with 40 approximate months for late autum . A negative NAO with +ve EA-WR and +v NCP and -CasHK with Urals high are possible configurations through the 60 days.


6
12
63
لو تحققت الحالة الماطرة فوق اراضي المملكة العربية السعودية مطلع مارس ستكون بعد مشيئة الله موافقة لسابقة لها و هي نادرة الحدوث اسمها نهر رطوبة(دينا Dena )سنة 2019 و تسببت #دينة بفيضانات فوق اجزاء من ايران و الشرق الاوسط جراء دفق رطوبة عبر التيار الافريقي من المحيط الاطلسي+الهندي

11
20
54
Looking forward confirmation from NWP models on the current configuration for 2nd third of February .


6
6
51
Southern , Western and Eastern Europe/
The regions within the black rectangles and purplish anomalous highlights in particular are at increased odds of flooding events and downpour of drenches between 11_20 OCTOBER.
(Austria, Ukrain, SE France, North Romania, Moldova)


4
9
52
End of February Possible Heavy/Immense/Torrential rainfall risk . The purple or blue color anomalies imply greater risk of rainfall/immense rainfall events . Purple implies torrential rainfall is possible . 1/2.


1
6
47
مطلع شهر #مارس :المناطق الموشحة بلون ازرق و فوشي عرضة للهطولات المطرية و الهطولات الغزيرة بالترتيب مطلع شهر مارس القادم . تستمر تلك الموجة من الامطار بين مطلع مارس و السابع من مارس و الله اعلم .هذه المخرجات مبنية على نموذج احصائي متعدد و تفسر على انها ارجحيات و ليس بالضرورة كميات

7
15
45
شبه الجزيرة العربية و دول الخليج العربي للفترة بين 25 يناير الجاري لغاية مطلع الشهر القادم ( فيبراير) : المناطق الموشحة باللون الازرق هي مناطق مرشحة لامطار بعضها قد يكون غزير الى غزير جدا في بعض الاوقات و خلال المدة المذكورة.الصور مرتبة زمنيا للمدة ذاتها على عدة ايام .


2
17
39
Winter January Synoptic possible configurations. Negative NAO, positive east atlantic western russian or NCP patterns and negative Caspian - HinduKush patterns are possible. Colder east mediterranean and balkans are likely.


3
4
40
احصائيا : محتمل تشكل حالة مدارية قبالة سواحل عمان و اليمن في المحيط الهندي بين مطلع نوفمبر و الثلث الثاني منه . و محتمل تشكل حالتين لاحقا شرق جنوب الصومال و شرق سواحل عمان و غرب شمال الهند .


5
10
37
November: The regions within the yellow rectangles are prone for immense rainfall events during November. Northern and Eastern fringes of the peninsula as well as its central and SW parts are likely to experience immense rainfall events during weather instability/ November.

8
11
37
1. An early January Eurasian Sudden Stratospheric Warming is possible acc. to extended analog forecast with 20-approximate seasons,most of those seasons are NOAA ranked Nino winters with measured SSW events during early winter (e.g.1994-95, 1966, 1983, 77-78, 2008-9, 1951, 1984)


4
9
35
ظاهريا المناطق ضمن المربعات لا تظهر شذوذ عالي للامطار لغاية 28 فيبراير الجاري لكن المناطق ضمن المربعات عرضة لامطار غزيرة على مرحلتين بين 20_25 فيبراير و نهاية فيبراير مع مطلع شهر مارس و بعضها يكون متسبب بجريان المياه و السيول بعد علم الله . سبب تلكؤ النماذج الرقمية في التعليقات.

6
12
32
JANUARY AND FEBRUARY Historical Records for Sudden Stratospheric Warming (SSW) associated Polar Vortex (PV) Displacements : This analysis is for Elnino events with PV displacements: Cold infiltration to EU and Southern USA imprint is still evident .


5
8
33
الفترة الاخيرة من مارس بين 26_31 مارس و مطلع ابريل/
في المرفقات اللونين الازرق و الارجواني تشير لارجحيات الهطول و استمرارية الطقسweather persistence التي يرافقها حالات طقس شديدة.تستمر فرص الهطول للجزيرة العربية و العراق و غرب عمان اليمن عبر اول ثلثين من ابريل و اوجها بعد 10 ابريل


5
10
33
اخر نشرة للموسم قبل ان ادخل حسابي بتويتر في فترة بيات للموسم القادم . المناطق الموشحة بلون ازرق و فوشي قد تكون عرضة للهطولات المطرية و الهطولات الغزيرة بين 14_17 مارس . و الله اعلم و احكم .
اراكم ان شاء الله في اول الخريف القادم .

2
5
32
السلام عليكم : توقعات شهرية ل #الجزيرة_العربية عبر شهري جولاي و اغسطس يوجد فرص عالية لتشكلات السيول و جريان المياه فوق الاراضي العمانية و الاماراتية كما يظهر بتحليل تماثلي موسمي متعدد المتغيرات تم عمله مؤخرا لموسم الصيف و قريبا انشر توقعات بعيدة للخريف بمشيئة الله لمخاطر السيول


8
5
31
February statistical based winter possible configuration: Negative NAO may persist Jan-Feb with clear negative Mediterranean (MOi) and a +Ve SCAND and a negative Caspian-Hindu Kush Oscillation . Colder and ranier W.Europe and North Africa is possible. 1/3


7
4
33
المرفقات تتعلق بحالات مطرية بين 18 مارس لغاية 23 مارس القادم . الالوان الازرق و الزهري توحي لهطولات غزيرة الى غزيرة جدا فوق مناطق جنوب عمان ج غرب السعودية اليمن و العراق و الصومال و شرق افريقيا . هذه النشرة قد تحتمل نسبة و هامش خطأ شرحته في التعليقات يرجى قراءتها للضرورة .


10
10
32
Awaiting confirmation from the numerical weather NWP models for this statistical based analog outlook. Formation of two cold troughs consistent with negative Scandinavia -SCND pattern are possible both sides of the Mediterranean. Snow is possible for high altitudes.


3
2
31
#فيبراير : الشهر الثاني من فصل الشتاء فيبراير, المناطق الموشحة بلون ازرق تميل لهطولات مطرية عالية و بعضها يميل لتسجيل فرص لللامطار الغزيرة و الغزيرة جدا و المسؤولة عن جريان المياه و ارتفاع منسوب المياه في شهر فيبراير حسب تحليل التكافؤ الموسمي بخاصية الشبكات العصبية . 1 من 3 .


7
3
29
Winter time MARCH possible configuration. The attached is statistical analog based. Negative NAO may persist with Negative East-Atlantic West Russian Oscillation WITH negative central african-versus-Caspian sea oscillations .


3
6
28
فرص تكونات خلايا السوبرسيل و السيول عالية لنصف اغسطس الجاري الثاني في المناطق الموشحة بالالوان من درجات الاخضر و الاصفر و اشدها الاحمر.فرص السيول عالية لعالية جدا في المناطق الموشحة بالاحمر و البرتقالي غرب السعودية و جنوب غربها و اليمن و اجزاء من شمال شرق السودان و خ. العربي .

6
4
28
S. Europe Statistical based outlook for the period between 5-17 April.Regions with bluish to purplish highlights are likely to measure immense rainfall events during the above period.This analysis is statistical based and requires confirmation with Numerical Weather NWP Models.


8
3
27
المناطق الموشحة بلون احمر او أخضر او اصفر ضمن المستطيلات مرجحة لحالات عدم استقرار و فرص لتشكل خلايا السوبر سيل نحو منتصف و اواخر شهر نوفمبر (11) و احصائيا. هذه مخرجات بنيت بنمذجة احصائية متعددة المتغيرات َ ثباتها بيد الله خالق الكون و مسير السحاب.


4
8
26
This configuration looks at the period between 19-24 February . A -Ve Scandinavian Pattern (SCND) may develop concomitantly with a Negative WeMOi and a + MOi Oscillations, hence cold infiltration to both sides of the Mediterranean is a possible ( but a likely ) consequence .

1
4
26
Following the contention of Autumn (Urasia) snowfall ( cold) during October predicts winter outlook by
@judah47
. Letting the cluster analysis decide the best 15 analog seasons for Autumn 2024 the below configuration emerges, this is conditional on a persistent +AMO in winter .

5
1
27
The attached images characterize the odds of severe weather as represented by CAPE index renalysis for the next period between Early Aug to Early Sept.The regions within rectangles with yellowish-green anomalies colors are likely for severe weather conditions during these decades


1
2
25
أخوتنا في عمان و الامارات و شرق المملكة العربية السعودية : نهاية فيبراير و مطلع مارس قد نشهد موجة هطول مشابهة للحالية و ايضا بداية ثلث فيبراير الاخير يوجد نشاط مماثل . الالوان الازرق و الفوشي تفسر على انها ارجحيات و عمق اللون لغزارة الحالات . الف لا باس . و الله اعلم .

6
7
25
April-June configuration based on statistical analogous outlook- multivariate adjusted. The Persia Trough PT with Red sea Trough RST may persist during April-June period but rainfall odds maximize in April for regions shown in the photos. Rainfall is for month of April. 1/2.


8
6
21
Central France, North and West Greece and North Spain and Portugal have high odds of immense rainfall events betwwwn 5-19 September according to this statistical analog based outlook. 1/2.

3
1
23
شهر فيبراير القادم قد يكون مميز مطريا للجزيرة العربية و العراق حسب المؤشرات الاحصائية . المرفق هو نمط الهطول لمطلع فيبراير الشهر الثاني و اللون الازرق يشي بفرص الهطول المطري و مناطقه المحتملة -اي المرجحة. تفسر الوان النشرة على انها ارجحيات و ليس بالضرورة كميات .

1
5
22
الاردن : المناطق المحاطة بمستطيل اصفر قرب البحر الميت و وسط غرب المملكة الاردنية الهاشمية مرجحة للسيول في الفترة بين 5_20 اكتوبر القادم . هذه المنطقة سبق و ضربتها سيول اودت بحياة 8 اطفال مدرسة سابقة و عطلت الحياة وسط العاصمة . شرق و جنوب شرق و شمال شرق البلاد مرجحة ايضا


3
5
23
توقعات الحرارة بشهر نوفمبر للخريف القادم بنموذج تماثلي متعدد يفترض تنامي إيجابية بمؤشر تذبذب بحر #قزوين_هندوكوش عبر شهر نوفمبر، جنوب الجزيرة العربية َ و جنوب شرقها مرجح بعد علم و مشيئة الله لبرودة من منشأ سيبيري تصل لليمن و لشرق السودان.


3
5
23
Blue and Purplish colors imply immense and very immense rainfall risks/propensity . This outlook is interim and is statistical based and it looks at the period between 8_16 March and may need to be confirmed with Numerical Weather Prediction Models next week for verification .


4
1
18
The persistence of Neutral to negative Central Africa-Caspian Oscillation (CACOi) between its dipoles (1 & 2 ) during Feb-Mar explains the wetter conditions over the East mediterranean (levant) and Southern Europe the remainder of winter months (Feb-early Mar).

4
5
19
The possible configuration for the 500mb geopotential height anomalies during December-January transition and January given by cluster analysis analog forecast algorithm (n=20 months). A +ve ( NCP, EA-WR , SCAND and WeMOi ) patterns may emerge with a -ve MOi. 1/2


4
2
20
Based on Machine Learning assisted Analog year forecasts the regions highlighted with blue anomalies within the rectangles have higher propensities for severe weather and immense rainfall events during November ( 2023 is not an exception ) .

3
4
20
The CAPE index Re-analysis with 20-approximate analogs for 2024 suggests high likelihoods of severe weather in the East Mediterranean basin, West Saudi Arabia and SE Iraq plus some spots in western Europe. Areas within
#rectangles
have higher odds for severe weather.

4
2
19
Based on Analog forecast of 20-seasons for Europe and the Mediterranean Region:The analysis suggests colder conditions N. Europe may prevail in February. Also cold weather could prevail over Balkans,Turkey , East Mediterranean and Saudi Arabia and parts of North Africa in March.


3
6
18
Depending on the transition of MJO phases early March. The attached scenario may extend between 1_7 March. This configuration is statistical multivariate adjusted analog forecast with 20 approximate seasons for March . God knows best .


4
1
17
شهر خمسة ( مايو ) : حسب المخرجات الاحصائية و مرتبطة بموجة مادين جوليان للفترة بين 1_13 من شهر خمسة القادم المناطق الموشحة بلون ازرق او ارجواني مرجحة بعد مشيئة الله لامطار بعضها غزير و قد يتسبب بالسيول . الافضل متابعتها عبر النماذج الرقمية لتوكيدها لانها توقعات بنيت احصائيا.


5
5
17
شهر #ديسمبر : نمط توزيع الضغط الجوي ( geopotential height at 500hpa) المتوقع بناءا على التحليل العنقودي لعشرين موسم مقارب للحالي بنمطه العام لفصل الخريف.التفسير: سيطرة منخفض جوي شمال قزوين يرافقه مرتفع فوق بحر الشمال و هذا متسق مع ايجابية في معامل تذبذب شرق الاطلسي-غرب روسيا,1/2

6
3
17
هذه البصمة المطرية باللون الازرق فوق منطقة شرق #اليمن و #الربع #الخالي و #عمان في شهر #ديسمبر تتكرر باختلاف طرق التحليل . التحليل الموسمي يوحي لامطار غزيرة فوق تلك المناطق المحددة بالمستطيلات . و الله اعلم . تفاصيل اكثر في الردود .

6
4
17
#November
: This time using the Discriminant FA followed by cluster analysis: Bay Of Bengal appears to have high odds of cyclonic activity under this statistical analogous outlook for early 14 days of November.Attached is the MSLP,500GPH,Vector wind & Precipitable Water anomalies.


2
6
17
1/4:The 500HPa Geopotential anomalies Analysis of SSW associated Polar Vortex (PV) Split Events : Analog Years used are NOAA ranked Nino's with Recorded SSW events followed by polar Vortex events splits during Jan/Feb.West and central European cold invasion imprint is evident.


4
3
17
@ssgeos
Well done, Frank ! I would plot the observed earthquakes versus those predicted .this tells a tale and is convincing for your audience. More fit between observed & predicted denotes your point makes sense scientifically!
2
0
16
بين 1_6 مارس . المناطق بلون فوشي قد تكون الهطولات فوقها غزيرة لغزيرة جدا . و الله اعلم .

5
4
17
#SEPTEMBER
CAPE index analysis. regions with Yellowish-Greenish and
#Red
highlights are at higher odds of severe weather and thunder storm risk through September ( decades ) . Outputs are statistical cluster analog based .


1
0
16
شهر مارس و ابريل : مناطق جنوب العراق و جنوب و شرق #الجزيرة #العربية و #بلادالشام و شمال #مصر و شرق #ليبيا تعتبر مناطق مرجحة بعد امر الله للهطولات الغزيرة . اللون الاصفر يوحي لارجحية ان تاتي هطولات غزيرة عبر الفترتين و الله سبحانه اعلم .


5
2
15
#AUGUST
CAPE index analysis. regions with Yellowish-Greenish highlights are at higher odds of severe weather and thunder storm risk through august ( decades ) . Outputs are statistical cluster analog based .


2
0
17
The attached images characterize March possible configuration as yielded from 20-season analogs identified with cluster analysis ANN that accounted 4 multivariable climatic oscillations and parameters with solar and length of day variabilities inclusive. 1/3


7
1
16
باعتبار شهري اكتوبر الجاري مع نوفمبر ( مجموع 60 يوم ) : المناطق الموشحة بلون ازرق مرجحة لعوامل شدة الطقس و احتمالات الهطولات الغزيرة عبر اي حالات مطرية او عدم استقرار قد يحدث عبر الفترة المذكورة . الالوان تمثل عمق الاحتمالات و ليس كميات الهطول بالضرورة . و الله اعلى و اعلم . 1/2

3
6
15
@AljareerMJO
The regions with bluish color highlights are likely for heavy rainfall and possible water runoff events for the last 10 days of December based on this analog forecast . Cyprus , the Levant countries shores, and East Iraq and central and W Saudi Arabia are possible regions.

3
6
16
North America and Pacific statistical outlook: Toward the middle part of the November ( late first decade and early second decade of the month) . I am unsure if the low pressure systems east and west of the USA signify cyclone activities but it is suggestive however. 1/2


2
1
16
February Likely Configuration for North America. Using too much or too little ( parsimonious) analogs may mislead the outlook. in this analysis I use Lanina Feb seasons as analogs for Elnino February . Twenty models /analogs are utilized in this analysis and is statistics based.

1
2
14
#اكتوبر /المناطق الموشحة بلون برتقالي او أخضر او احمر او اصفر في الصور المرفقة ضمن مستطيلات مرجحة بشكل كبير لفرص تشكل السيول و جريان المياه بشهر أكتوبر القادم و الله اعلم.
هذه مخرجات نظمها الكمبيوتر بتحليل تكافؤ الموسم و تعتبر احصائية و أولية. و الله اعلم.


3
3
14
JANUARY Europe Risks of Immense rainfall, extreme rainfall and Freeze @ 2M level Temperatures as yielded from the 20-season analogs.Purple and Blue highlights may imply greater risk of severe rainfall / freeze during
#January
. I will soon do analysis for February-March periods.


3
1
15
The middle third of March and according to long time-series analysis of multi-climatic oscillations analog outlook: The Iberian Sea, Central Mediterranean and MENA states may experience stormy conditions with immense rainfall south Europe being likely . This is Interim of course

2
1
13
بتحليل قاعدة بيانات ERA5 بخاصية التحليل العنقودي و الشبكات العصبية للتكافؤ الموسمي الشهري ل #نوفمبر الجاري المناطق ضمن المستطيلات و موشحة بلون اصفر تشهد هطول مطري غزير لغزير جدا عبر اسابيع هذا الشهر و هذا متسق من مخرجات جيفس تقريبا لغاية 20 نوفمبر مرفق بالردود,و الله اعلم و احكم

3
10
14
April statistical analogue for southern Europe & MENA. Colder Balkans and E. Europe and middle eastern countries . Areas within rectangle are potentially risky for flood risk. Yellow rainfall highlights imply greater rain and green less in general. 1/2 .


5
5
15
Statistical Analogous outlook for DECEMBER : The attached analysis shows high propensity for stormy conditions that MAY prevail in the Eastern Mediterranean basin during December according to the recovered climatic imprint. 1/2


4
4
14
@AljareerMJO
صباحك فل د خالد. بناءا على تحليل الارشيف بخاصية تكافؤ المواسم لشهر #نوفمبر المناطق المظللة باللون الازرق مرشحة ( اي مرجحة) لامطار فائقة حسب مؤشر اركن-زاي للهطولات الفائقة.شدة الالوان تعكس الاحتمالات و ليس بالضرورة الكميات,الكميات على العكس نراها عبر نماذج توقع الطقس الرقمية .

2
2
13
Also, this statistical-based analog outlook for the period between 14_17 February can be taken with a grain of salt until the Numerical Weather Prediction NWP Models will ascertain it later.Immense rainfall is predicted over North Algeria, Tunisia, West Italy land & Balearic Sea.


1
4
14
Early september to Mid september risk of supercell formations according to the statistical analogs model . regions with yellow, red, orange and greenish colors are risky for floods and possible supercell formations. all regions within boxes are possible.


1
1
13
What about February risk of NH Polar Vortex (PV) Sudden Stratospheric Warming SSW Events ?
Based on the cluster analysis and ANN guide analog forecast: Moderate Risk and PV appears to be tightened North.Please Note comments for statistical modelling details used in this analysis


4
1
13
SEP-OCT: The tropical humidity possible impact on East Anatolia for September and October unveils potenial immense rainfall ods West of Caspian Sea and SE fringes of the black sea Plus NW Iran . This is a statistical analog based outlook. blue colors imply severe rainfall odds.


4
2
14
هل السيول الحالية في منطقة بحر العرب و عمان و افغانستان و باكستان امر مستجد و نادر الحدوث؟ الاجابة المختصرة هي لا , هذه الاحداث تتكرر نسبيا في بعض الظروف المناخية و هي ظروف محددة و سبق حدثت في ارشيف تلك المناطق اخر 90 عاو كما يظهر بالتحليل المرفق.


6
2
13
This configuration is gaining recognition by the American GFS system . A Negative Caspian-Asian Oscillation telleconnection may enhance North-West penetration of cold trough toward West Turkey and Greece . Severe cold wind is possible in Crete Sea between 21_24 February .
Awaiting confirmation from the numerical weather NWP models for this statistical based analog outlook. Formation of two cold troughs consistent with negative Scandinavia -SCND pattern are possible both sides of the Mediterranean. Snow is possible for high altitudes.
3
2
31
2
3
13
MID OCTOBER: Sicilian Low pressure (SL) systems tend to form usually toward the central mediterranean south of Italy under such seasonal conditions and transitioning near the middle third of October . This analysis output is statistical analog based.


2
1
13
Late winter (FEB-APR) Freezes and cold are possible risks over Balkan,Turkey,SE Europe & MENA regions with Agricultural & agribusiness implications & Risks.These conclusions are statistical based however. Spatial & temporal differences may emerge later but propensity of cold is⬆️
Based on Analog forecast of 20-seasons for Europe and the Mediterranean Region:The analysis suggests colder conditions N. Europe may prevail in February. Also cold weather could prevail over Balkans,Turkey , East Mediterranean and Saudi Arabia and parts of North Africa in March.
3
6
18
4
3
12
#الجزيرة #العربية و #بلاد_الهلال_الخصيب:
في حال تم تسجيل احترار ستراتوسفير للقبة حسب ما يشاع حاليا مطلع ديسمبر و بالعتبة المطلوبة لاحداث تغيير في نمط الامطار فان توزيع الامطار و مخاطر السيول يكون كما هو معاد بنائه في الصور من التحليل العنقودي لستة مواسم ديسمبرية مكافئة للموسم1/3


5
1
13
Balearic sea and North Africa are likely to experience severe weather events in September according to the statistical analog outlook. Particularly the second half of SEPTEMBER. Wind anomalies are post in the comments.
#SEPTEMBER
CAPE index analysis. regions with Yellowish-Greenish and
#Red
highlights are at higher odds of severe weather and thunder storm risk through September ( decades ) . Outputs are statistical cluster analog based .
1
0
16
1
1
13
Maybe the worst hasn't come yet concerning flood risk and supercell formations for August in Yemen, Arabian Gulf region plus India & Pakistan.The Red colored highlights within circles in the maps imply higher risks for FLOODS and torrential rain.This is statistical driven outlook


3
4
12
تحيليل رطوبة التربة المنظورة حسب النموذج التماثلي الاحصائي للاشهر بين #اكتوبر و #ديسمبر . المناطق الصفراء و البرتقالية و الحمراء و ايضا الخضراء تسجل رطوبة تربة عالية عبر المدة المذكورة.مناطق السهوب و شبه الصحراء المرتفعة و التي تتلقى رطوبة عالية تكون افضل بيئة للكمأ - #الفقع.

3
1
12
More analysis outputs for the period between 19_23 April attached. dates are approximate and not guaranteed. again purplish color implies immense rainfall risk according to the historical archives given the current season configuration


0
1
12
1.January Precipitable water rate : Blue color implies greater rainfall risk but not necessarily a flood risk . 2.Arkin-Xie STD analysis helps with viewing severe rainfall risks however. Colors imply propensity not amounts of rainfall . Statisticized by


2
2
12
Those statistical analog based outlooks for September are gaining increased Convergence on numerical weather forecasting models for September. Balearic sea, north and east Spain and North africa are predicted ( possibly) for stormy and severe weather conditions during September.
#SEPTEMBER
CAPE index analysis. regions with Yellowish-Greenish and
#Red
highlights are at higher odds of severe weather and thunder storm risk through September ( decades ) . Outputs are statistical cluster analog based .
1
0
16
0
0
11
المناطق الموشحة بلون اصفر في الصور مرجحة لحالات السوبرسيل في اواخر الشهر الجاري سبتمبر و مطلع اكتوبر . منطقة شط العرب , الكويت , جنوب العراق و جنوب غرب اليمن مرجحة لحالات مطرية بعضها فيضي الطابع حسب المخرجات المبنية تماثيليا و احصائيا. و الله اعلم .
Statistically speaking: The regions highlighted with reddish-orange colors within the rectangles have high risk ( propensity) for immense rainfall and thunderstorm events during late September and early October according to the statistical cluster analysis based analog outlook.


2
1
10
1
4
11
#مارس:نمط هطول الامطار و احتمالات السيول خلال ثالث اشهر الشتاء (مارس ) بناءا على تحليل الشبكات العصبية و التحليل العنقودي لتكافؤ المواسم لعام 2023-2024 بعد مشيئة الله . الالوان الصفراء و الزرقاء توحي لفرص اعلى للامطار و احتمالات السيول . و الله سبحانه هو الاعلم و الاحكم . 1 من 3


4
4
11
@rashidalmethen
و الوضع مرجح للتكرار اخَي راشد، حساب التليكَنكتيفتي يوحي لظروف اسوء في سبتمبر و حتى أكتوبر. نشرت عنها من شهر و نص و ماحد اكترث للاسف
حجم الدمار بالحديدة مفجع و ساعات الصبح يتكشف حجم الضرر
1
3
11
We should be waiting for confirmation from numerical weather prediction models for this outlook between 11_17 April which is statistical based for the Levant, Anatolia and Saudi Arabia .Blue and Purplish color highlights denote risk of severe rainfall and supercell formation risk


4
3
11
I hope the below statistical outlook is getting recognition by Numerical Weather Prediction NWP Models as can be seen in the attached run from GFS this evening and its typical for MJO (Phases 3_6) for April .These phases may persist up to 25 April from an interim statistical view


1/3 comments: Southern Western Europe and North Africa for the period between 15_22 April.The regions highlighted with bluish to purplish colors are possible for Immense rainfall events.This rainfall pattern is uncovered statistically and congruent with MJO Phases 3_6 for April
11
20
81
6
2
11
The parts of India ( North West ) & Pakistan within the red rectangles are likely for severe rainfall events particularly the Indian side. The period is between 23 Aug to 3 Sept. Purplish color implies high probability.Medhya Pradesh, buhpal Ahmadiabad,Nandid Taluka are ↑↑risk

2
1
11
The floods in Oman and UAE Dubai were detected via the statistical analogous method and warned several weeks ago . I am regretting not reshsaring them several times .

1
4
11
2/2 : The accompanying air temp at 850 hpa level . Hopefully it will be consistent with NWP models but i can see some agreement between this analysis method with that yielded from the ECWMF for the next 4 weeks . God knows best!

1
1
11
More of my statistical based witchcraft. The
#February
Month average 500mb Geopotential composite anomalies for 20-analogous seasons

2
0
10
Interim analysis for the first third of February .
نظرة اولية للثلث الاول من شهر فيبراير القادم توحي لنزولات باردة صوب منطقة شرق المتوسط و شبه الجزيرة العربية . شرح اكثر بالتعليقات .


3
4
8
#Turkey
outlook for precipitable water during March based on the statistical analogous analysis. The color depth ( Blue/purple ) implies for propensities of rainfall and /severe rainfall respectively . Regions with deep purplish colors are at⬆️ odds of torrential rain events

1
1
10
West
#India
and Parts of
#Pakistan
and
#Bangladesh
are predicted (Likely) to experience severe rainfall events & risks of flood events during the last 17 days of SEPTEMBER according to the statistical analogous analysis outputs attached to this post.1/2


5
1
10
Statistically speaking: The regions highlighted with reddish-orange colors within the rectangles have high risk ( propensity) for immense rainfall and thunderstorm events during late September and early October according to the statistical cluster analysis based analog outlook.
2
1
10
November: Severe Rainfall odds as yielded from 20-months analogs assisted with ANN and cluster Analysis of ERA5&NCEP Databases . Blue and Yellow highlights imply severe rainfall and water precipitation risk during
#November
. Both database analyses converge well with NWP outlook


5
6
10
@hogrbe
Extraordinary claims require extraordinary evidence.combine your SSGI analyses over longer vector of time with TEC anomalies for certain geography .SSGI apparently can be dismantled into more components.I've shared this with you via an email sometime.Your work makes sense . ...
2
1
9